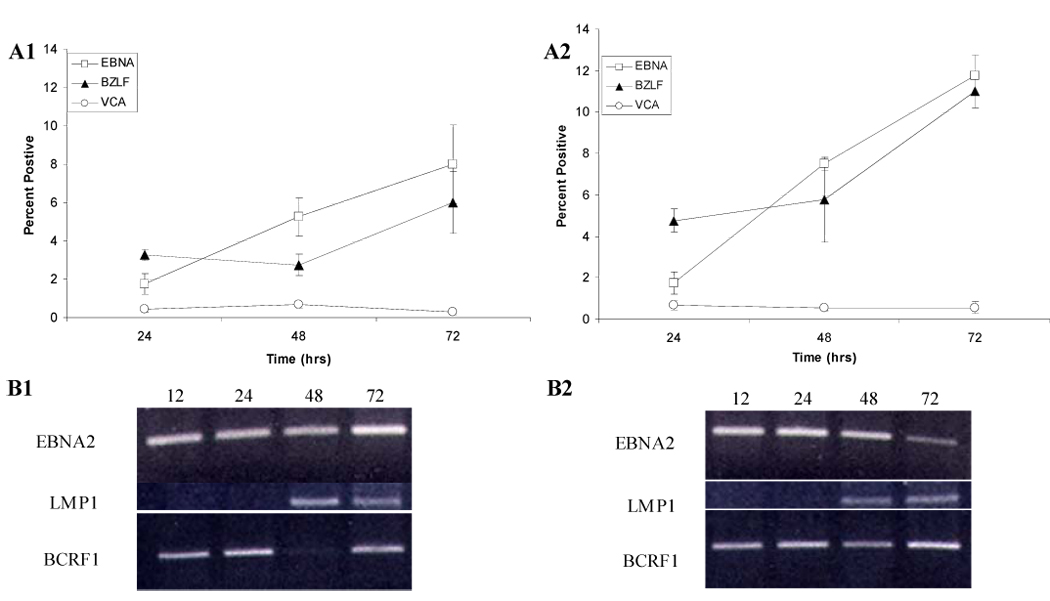
Figure 2.

Kinetics of gene expression in EBV-infected primary B lymphocytes. B cells were harvested at intervals as indicated (hours post-infection) and analyzed by flow cytometry or RT-PCR techniques. (A) Flow cytometric analysis of 2 × 10⁶ EBV-infected B cells treated with PBS (A1) or 100 nM DMDTC (A2) using antibodies against: EBNA2, BZLF-1 and VCA (viral capsid antigen p120). Values represent Mean + S.E.M. (n=4). (B) RT-PCR analysis of RNA extracts from 1 × 10⁶ EBV-infected B cells treated with PBS (B1) or 100 nM DMDTC (B2). Representative agarose gel (n=6) of PCR products for EBNA2, LMP1 and BCRF1 is shown. Primers for the specific transcripts and PCR conditions are indicated in Materials and Methods.
