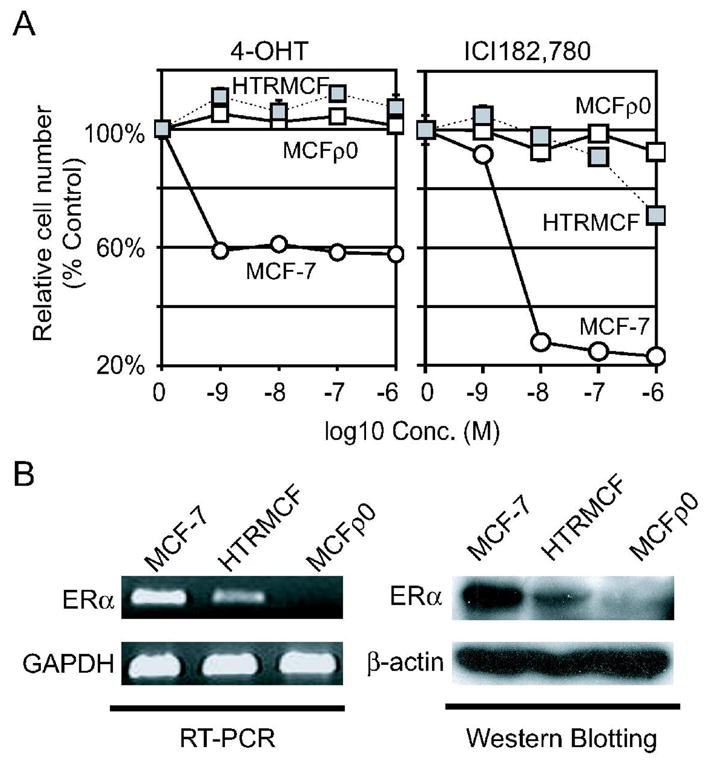
Figure 2.

A, , The cell number of MCFρ0 cultured under 4-OHT or ICI182,780. MCFρ0 cells cultured under the indicated concentrations of 4-OHT or ICI182,780 were plotted in left and right panel respectively. The relative cell numbers of MCF-7 and HTRMCF were also plotted for comparison. See figure 1 legend for more details. B, The expression of ERα. The expression of ERα in MCF-7, HTRMCF and MCFρ0 was analyzed by RT-PCR (left panel) and Western blotting (right panel).
