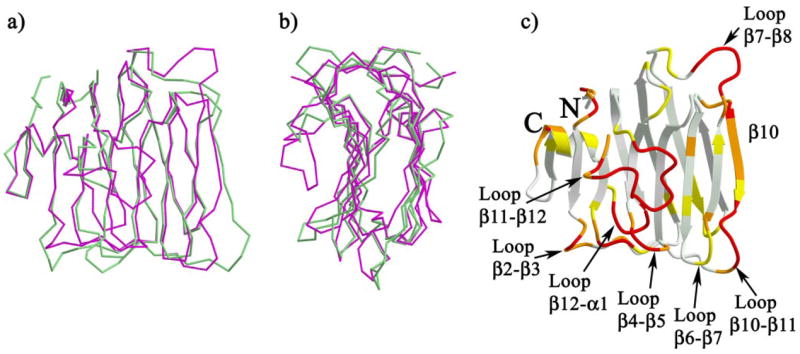
FIGURE 3. Superposition of n1α_LNS#2 and n 1β_LNS.

a and b, face and side views of the polypeptide Cα-trace superposition of n1α_LNS#2 (magenta) and n1β_LNS (green); c, ribbon diagram of n1α_LNS#2 colored according to the r.m.s.d. between pairs of structurally analogous Cα atoms from representative structures of n1α_LNS#2 and n1β_LNS: white (≤0.5 Å), light yellow-green (0.5 < r.m.s.d. ≤ 1.0 Å), yellow (1.0 < r.m.s.d. ≤ 1.5 Å), orange (1.5 < r.m.s.d. ≤ 3.0 Å), and red (>3.0 Å or not present in n1β_LNS). The N and C termini are indicated with N and C, respectively; loops and strands referred to in the text are indicated. Superposition and analyses were carried out using routines in LSQMAN (52) as described under “Experimental Procedures.”
