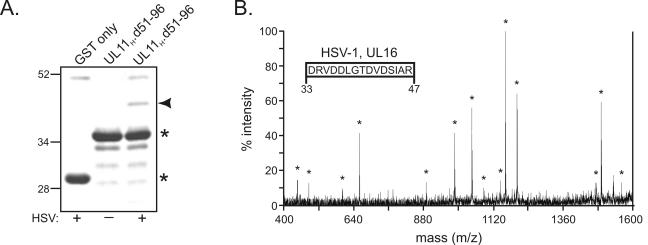
FIG. 4.
Direct analysis of the 40-kDa protein by MS. (A) Visualization of the 40-kDa band by zinc staining. The 40-kDa protein (denoted by an arrowhead) was pulled out of unlabeled, HSV-1-infected cell lysates with GST.UL11H.d51-96 and separated by SDS-PAGE. The gel was negatively stained with a Bio-Rad zinc stain kit; the isolated 40-kDa band was cut from the gel, digested with trypsin, and analyzed by MALDI-TOF MS. Asterisks denote the positions of the GST derivatives on the gel. Plus or minus signs indicate that GST proteins were mixed with HSV-1-infected cell lysates or not, respectively, prior to being loaded on the gel. Numbers at left indicate kilodaltons. (B) MS-MS spectrum of the 1,646-Da tryptic peptide. The 10 most abundant peptide fragments on the MS spectrum were identified and further analyzed by tandem MS-MS ion fragment analysis. The resulting MS-MS spectrum of the 1,646-Da peptide was used to determine its sequence (inset), which was then examined for matches with the sequences of all known proteins. Residue numbers within the HSV-1 UL16 protein are indicated below the inset. Asterisks denote MS-MS peaks that were used in elucidating the 1,646-Da peptide sequence.

