
Figure 2.
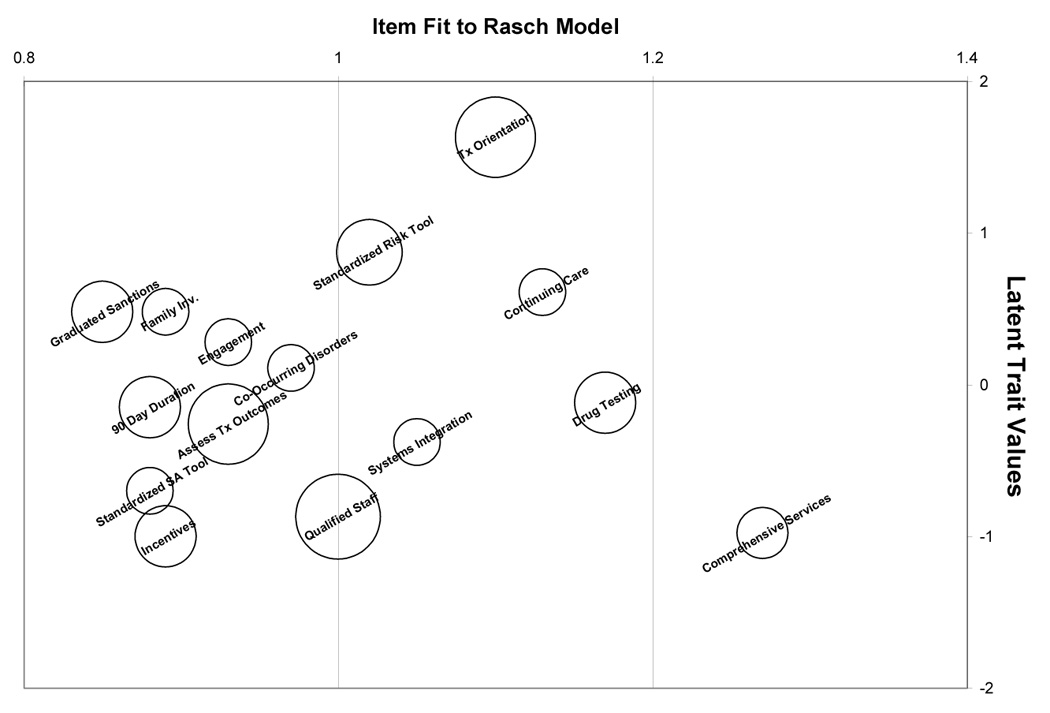
Bubble chart of the 16 EBPs administered to the adult sample. The vertical displacement of the bubbles illustrate the “difficulty” of the item; items with negative values indicate a greater likelihood of use. Fit to the Rasch model is illustrated by the horizontal displacement of the items, with better-fitting items obtaining infit values closer to 1 and acceptable infit values occurring between 0.6 and 1.4. The size of the bubbles reflects the precision of the estimates or standard errors.