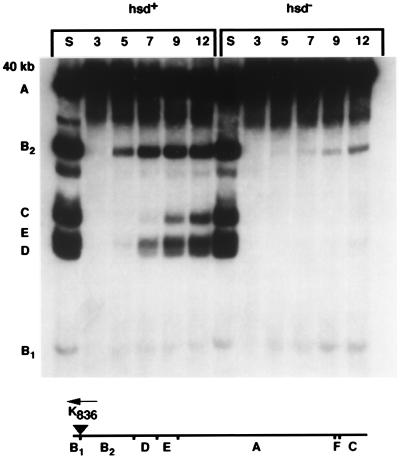
Figure 3.
Autoradiogram depicting the time course of methylation of sRK836sK0 DNA during the infection of the hsd+ strain IJ891(pTP166) and of the isogenic Δhsd strain IJ1133(pTP166). Cells were pretreated with rifampin and infected at a multiplicity of 0.4. Lanes marked S correspond to sRK836sK0 DNA digested with Sau3AI and illustrate the cleavage pattern when every GATC site in the genome is cut. Time (in minutes) after infection is shown above the lanes. DpnI fragments are indicated by letters to the left, and their location on the phage genome is shown on the map below the panel; the single EcoKI recognition site (triangle) is also indicated. The 103-bp G fragment is not indicated.

