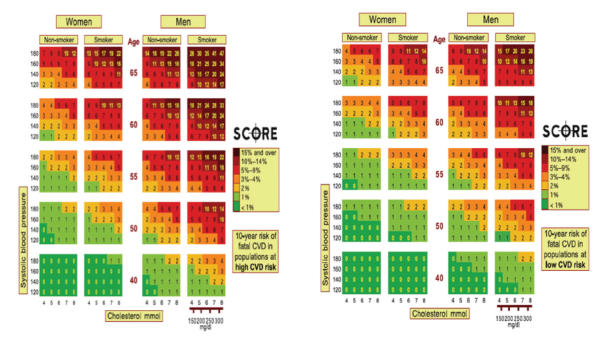
Figure 3.

Risk charts in high risk and low risk populations, according to the SCORE Project. Copyright © 2003. Conroy RM, Pyorala K, Fitzgerald AP, et al for the SCORE project group. 2003. Estimation of ten-year risk of fatal cardiovascular disease in Europe: the SCORE project. Eur Heart J 24:987Z 1003.
