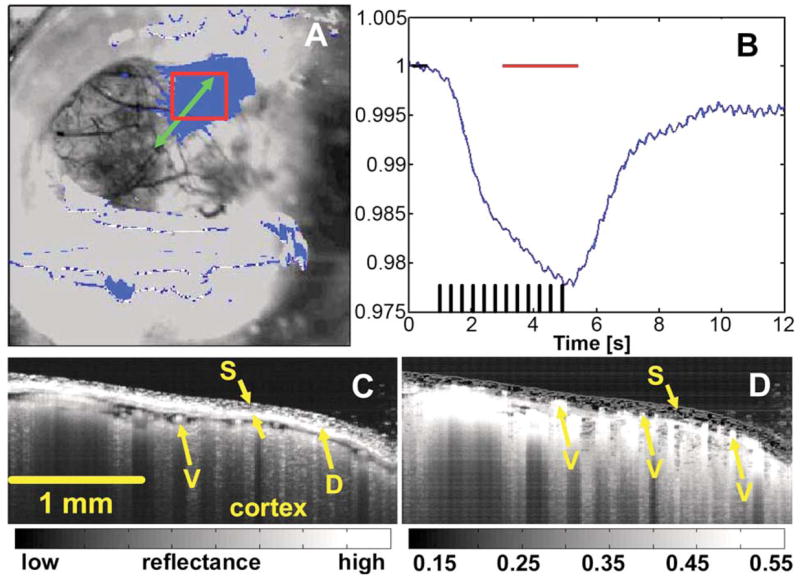
Fig. 2.

(Color online) Precise registration of OCT imaging to the region of functional activation. The OCT scan is directed in the region of interest measured with video microscopy (A, B). Horizontal bars in B mark the activated and baseline time windows used to generate the functional map in A. Structural OCT imaging (C) visualizes the skull (S), surface vasculature (V), and meningeal layers, including the dura mater (D). Percent variation maps extracted from the multiple trial data set reveal smaller vessels above the dura, while highlighting the low signal fluctuation in the skull compared when with the cortex.
