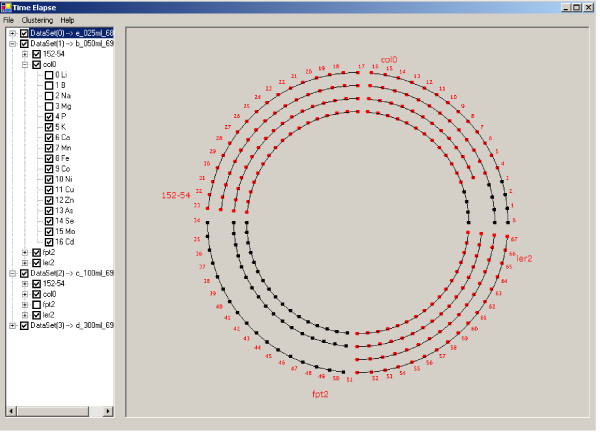
Figure 6.
Comparative analysis of 'omics expression data. Molecules are aligned in concentric circles based on molecular name and experimental group. Experimental groups (sets) are displayed as concentric arcs of the circles with each circle representing a separate comparative experiment. Molecules indicated in red are identified in each experiment in the set. Molecules indicated in black were not identified in all comparative experiments. The outer most circle provides an index of every molecule detected in the comparative studies with a designated index number which can be used to find the relevant experimental and molecular information on the left panel lists. The user can interactively select or de-select molecules and experimental groups in the left panel, and the related information will be automatically displayed in the graphic.

