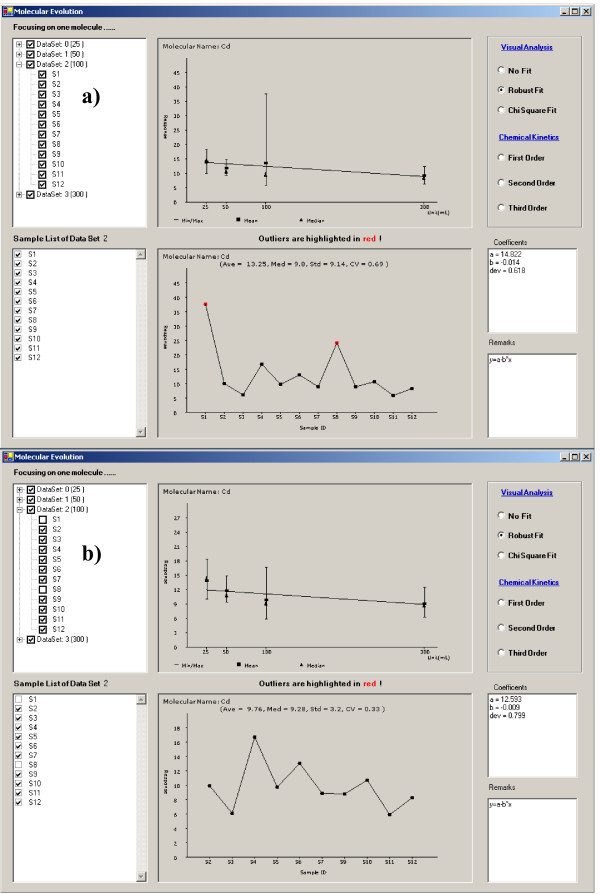
Figure 7.
Display of molecule behavior in a comparative analysis. The second comparative experiment labeled as DataSet 2 on the upper left panel is the active experiment group including the molecular expression levels of the molecule of interest (cadmium, Cd) in each sample displayed in the lower graphic panel. a) the expression levels of this element in samples 1 and 8 were detected as outliers and highlighted in red; b) the outliers in the active experiment have been removed by un-checking S1 and S8 in the left panel.

