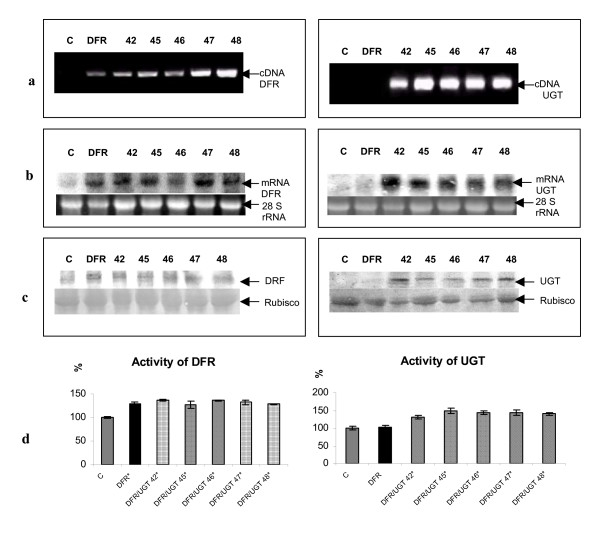
Figure 4.
Selection of transgenic plants. a) Agarose gel electrophoresis of PCR products obtained with primers for DFR (1143 bp) cDNA and UGT (1100 bp) cDNA on genomic DNA isolated from tissue-cultured potato plants. C: negative control (non-transformed plant). DFR: transgenic plant over-expressing DFR. Transgenic lines over-expressing DFR and UGT are numbered. b) Northern blot analysis of RNA isolated from tubers of control plant (marked C), tubers of transgenic plant over-expressing DFR and tubers of independent transgenic lines over-expressing DFR and UGT (numbered). 50 μg of total RNA was loaded onto each lane, and the first blot was hybridized with 32P- labeled DFR cDNA and the second blot was hybridized with 32P- labeled UGT cDNA Bottom panel shows ribosomal RNA stained with ethidium bromide as a control of RNA applied onto the gel. c) Western blot analysis of protein extract isolated from the potato tuber. Blots were probed with anti DFR antibodies (left) and anti UGT antibodies (right). C: negative control (non-transformed plant). DFR: transgenic plant over-expressing DFR. Transgenic lines over-expressing DFR and UGT are numbered. Bottom panel is the ribulose-1,5 bisphosphate carboxylase/oxygenase (Rubisco) on the same blot stained with Pounceau red. d) Activity of UGT and DFR in transgenic and wild type potato plants DFR and UGT over-expressing plants (numbered-striped bars) were analyzed and compared with transgenic plant over-expressing DFR (DFR- black bar) and with the control (C- grey bar). Asterisks (*) indicate values that are significantly different from the wild type plants with p > 0.05.

