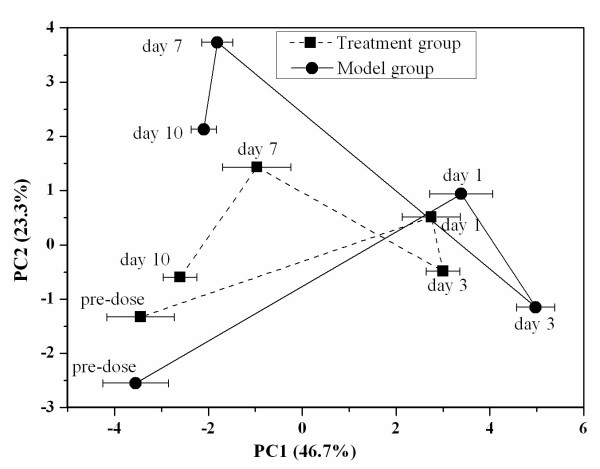
Figure 2.
Mean trajectory of PC1 vs PC2 scores for urine samples from the model group (-●-) and treatment group (--●--). Each dot denotes a mean score at different time points, i.e. pre-dose, days 1, 3, 7 and 10. Error bar represents the standard deviation for each time point obtained by the first principal component.

