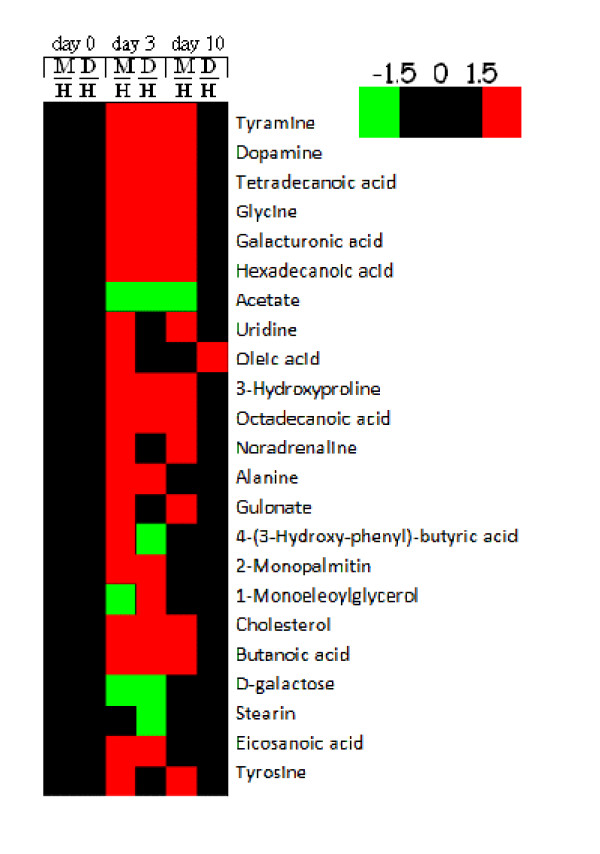
Figure 4.
Fold changes of the key metabolites. Red color denotes relative elevated concentrations (fold changes > 1.5), whereas green color denotes relative reduced concentrations (fold changes < -1.5). Fold changes ranging from -1.5 to 1.5 are considered to be physiological variations. A fold change (M/H, D/H) is the concentration ratio of the model group or treatment group to the control group.

