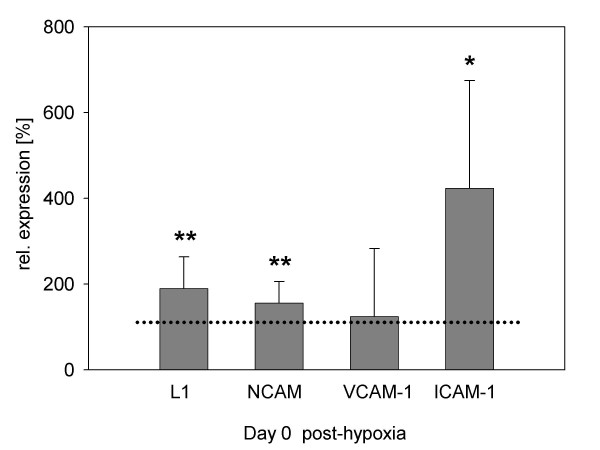
Figure 8.
Expression of adhesion molecules after 48 hours of hypoxic cultivation. Fluorescence intensities of cell lysates are shown after subtraction of specific isotype values with respect to normoxia. Data arise from six independent experiments. The dotted line indicates level of adhesion molecule expression (100%) in normoxic control cultures. Note statistically significant upregulation of L1, NCAM and ICAM-1 post-hypoxia.

