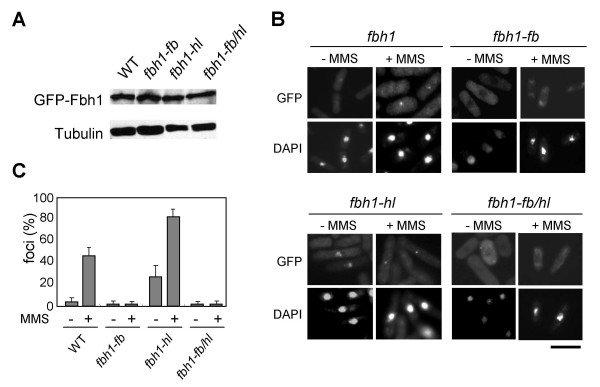
Figure 3.
DNA damage-induced focus formation of Fbh1 mutant proteins. (A) Protein extracts were prepared from the indicated strains expressing GFP-wild type or mutant fbh1. Samples were analyzed by SDS-PAGE followed by western blotting with anti-GFP or anti-α-tubulin antibodies. (B) Cells expressing GFP-wild type or mutant fbh1 were incubated in EMM2 without or with MMS (0.1%) for 2 h at 30°C and observed by fluorescence microscopy. The upper and lower panels show GFP and DAPI images, respectively. The scale bar indicates 10 μm. (C) Quantitative analysis of GFP-Fbh1 foci. Cells with Fbh1 foci were counted and divided by the total number of cells. More than 150 individual cells were scored for each strain. The result represents the average of three independent measurements.

