
Figure 2.
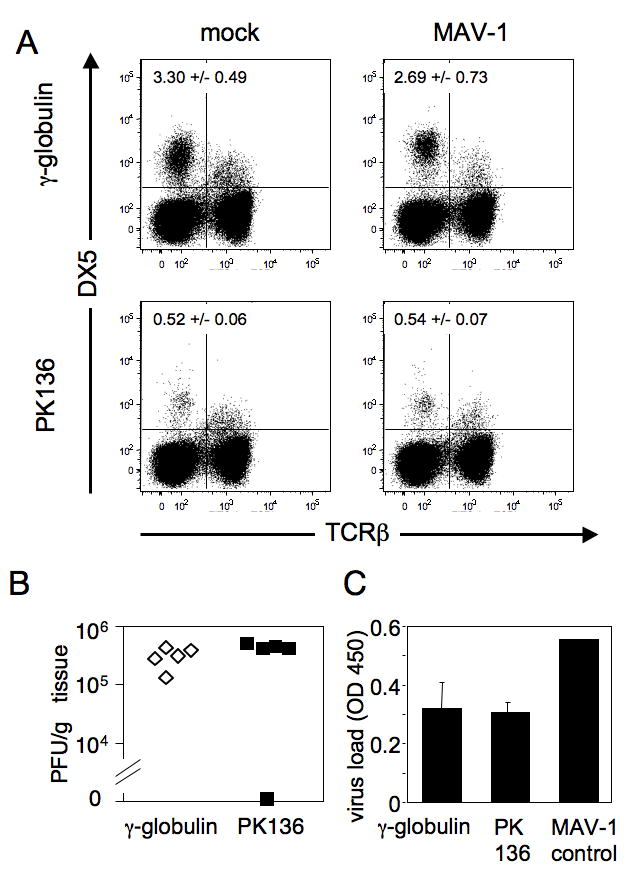
NK cell depletion and infection in C57BL/6NCr mice. A. Representative example of flow cytometric confirmation of depletion. C57BL/6NCr mice were mock depleted using a γ-globulin control antibody (upper panels) or were depleted of NK cells using PK136 (lower panels). On days -1 and 0 animals were injected i.p. with 100 μg of antibody. Intraperitoneal infection with 103 PFU of MAV-1 or mock infection also occurred on day 0. Splenocytes isolated from mice 8 days p.i. were analyzed individually and one mouse of each treatment group is shown. Percentages of NK cells in the spleen are indicated in the upper left quadrant (DX5+, TCRβ-) for the four treatment groups; values are the mean and standard deviation for all the mice in each treatment group (n = 4-5 per group). Depletion results were confirmed by staining for NK1.1 instead of DX5 (data not shown). B. Viral loads in the brain were determined by plaque assay for each animal, treated either with control γ-globulin or PK136, as indicated. Serially diluted MAV-1 was concurrently titrated as a positive control (data not shown). Results are one example of three replicate experiments performed. C. Viral loads were also determined for the same animals as in B using capture ELISA. The MAV-1 control is an internal standard run in each assay as a positive control for the ELISA.