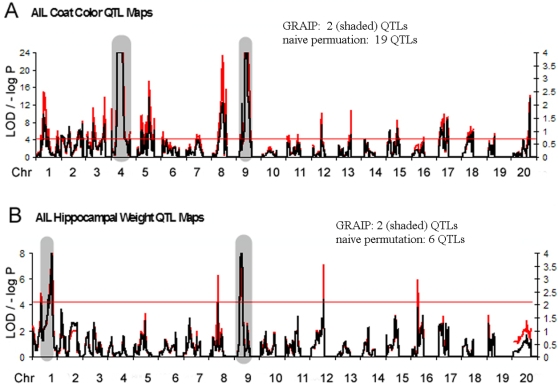
Figure 3. Coat color (A) and hippocampus weight (B) in the UTHSC AIL population Red traces are the simple mapping output, and the red bar is genome-wide P = 0.05 by naïve permutation.
Black traces are GRAIP permutation output. Note that for ease of graphing on a -log scale we have adjusted P<1/10000 to P = 0.0001, so the maximum –log P = 4. Simple mapping results are on the left hand scale, while GRAIP results are on the right. On the Chr.4 coat color locus simple mapping value is truncated at LOD = 25, to simplify reading the graph. Shaded gray regions are significant at genome-wide P = 0.05 or better in the GRAIP results.

