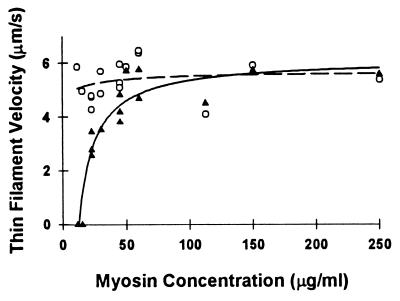
Figure 2.
Thin filament velocity of actin (○) and actin–Tm (▴) as a function of myosin loading concentration, which in turn determines the motility surface density. Each data point represents an individual experiment in which the mean of at least 20 individual filament velocities are reported. The regression lines for actin–Tm (solid) and actin (dashed) were obtained by fitting the data to the hyperbolic function: y = y0 + (ax)/(b + x); the fit is solely intended to delineate the velocity differences between actin and actin–Tm. The parameters of the fit for actin and actin–Tm were as follows: actin (y0 = 4.71; a = 0.96; b = 19.72); actin–Tm (y0 = −346.91; a = 353.02; b = 0.21).

