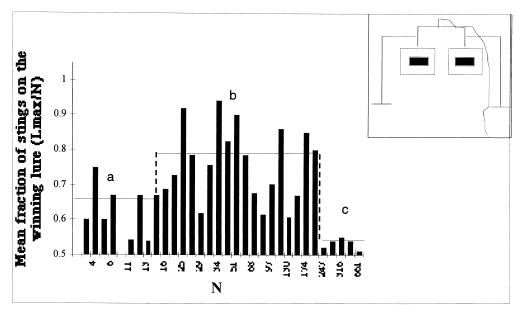
Figure 1.
Evaluation of the relationship between the fraction of the number of stings on the most attacked lure (Lmax/N) and the total number of stings on the two lures (N) carried out in a function of N. A value close to 0.5 indicates a symmetrical attack. Three zones are observed: two (a and c) without significant difference when compared with a binomial of parameter 0.5 (χ2 = 1.68 and 4.35 for 19 and 4 df, respectively) and one (b) with significant difference when compared with a binomial of parameter 0.5 (χ2 = 204.3 for 20 df). The solid line indicates the mean value of Lmax/N for each zone. (Inset) Experimental setup (see Materials and Methods).

