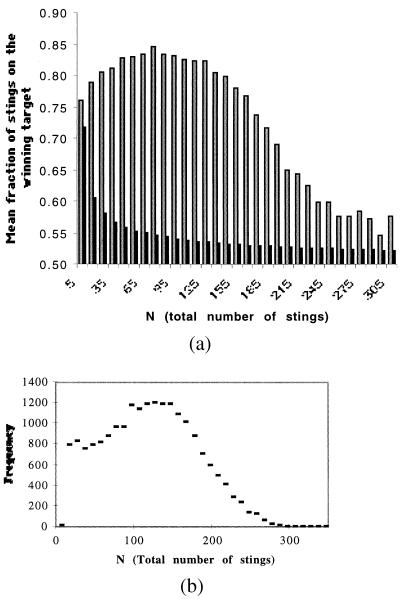
Figure 3.
(A) The relationship between the mean number of stings on the most attacked lure (Lmax) and the total number on the two lures and this relationship in a function of the total number (N) produced by the model (open bars). a = 1; b = 0.5; a′ = 8,000; γ = 0.5; δ = 15; the number of bees involved B = 500. N1 = N2 = 0. The second curve corresponds to the same ratio (Lmax/N) but for a random and constant probability to sting (black bars). (B) The distribution of the total number of stings for the corresponding simulation.

