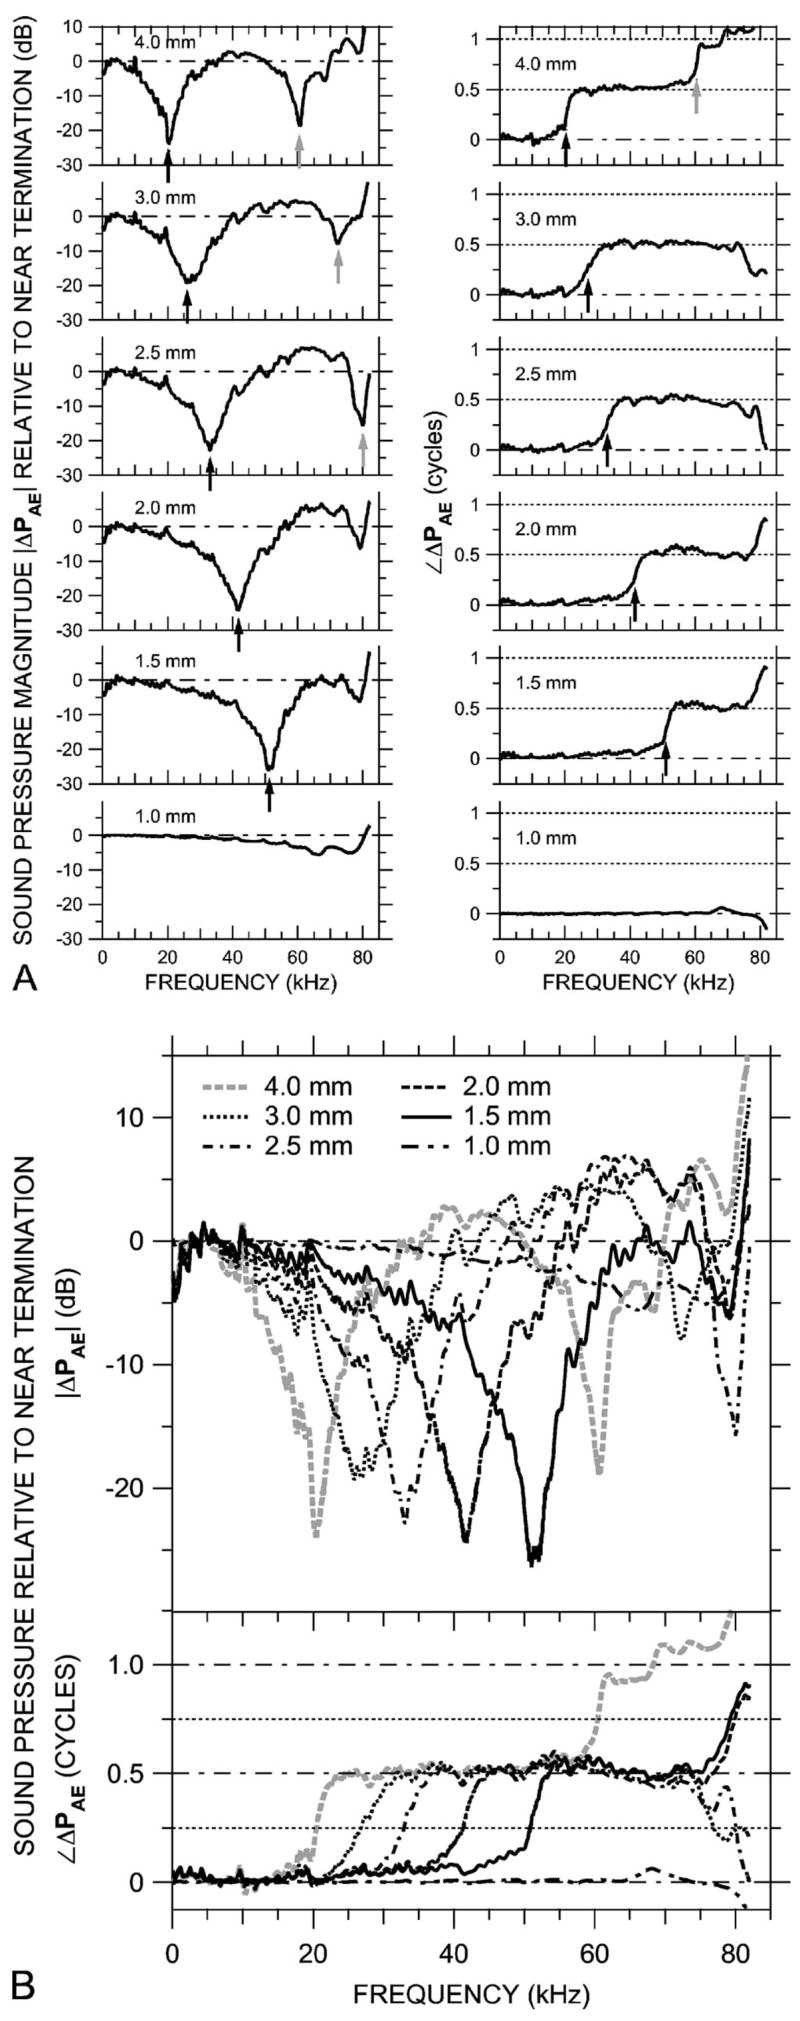
FIG. 10.

Variations in sound pressure PAE measured axially in 0.5-mm steps within an artificial ear with the probe-tube microphone (at MEEI) in response to a chirp stimulus. The artificial ear was terminated with a -in. condenser microphone. (A) ΔPAE, the ratio of PAE at six locations to PAE near the termination, shown individually on a linear frequency scale. Left: Magnitude ratios in decibels; right: phase differences. Arrows indicate frequencies of |ΔPAE| notches and frequencies where ∠ΔPAE crosses 0.25 or 0.75 cycles. (B) The ΔPAE curves from (A) superposed, plotted on a linear frequency scale. Top: Magnitude ratio in decibels; bottom: phase difference.
