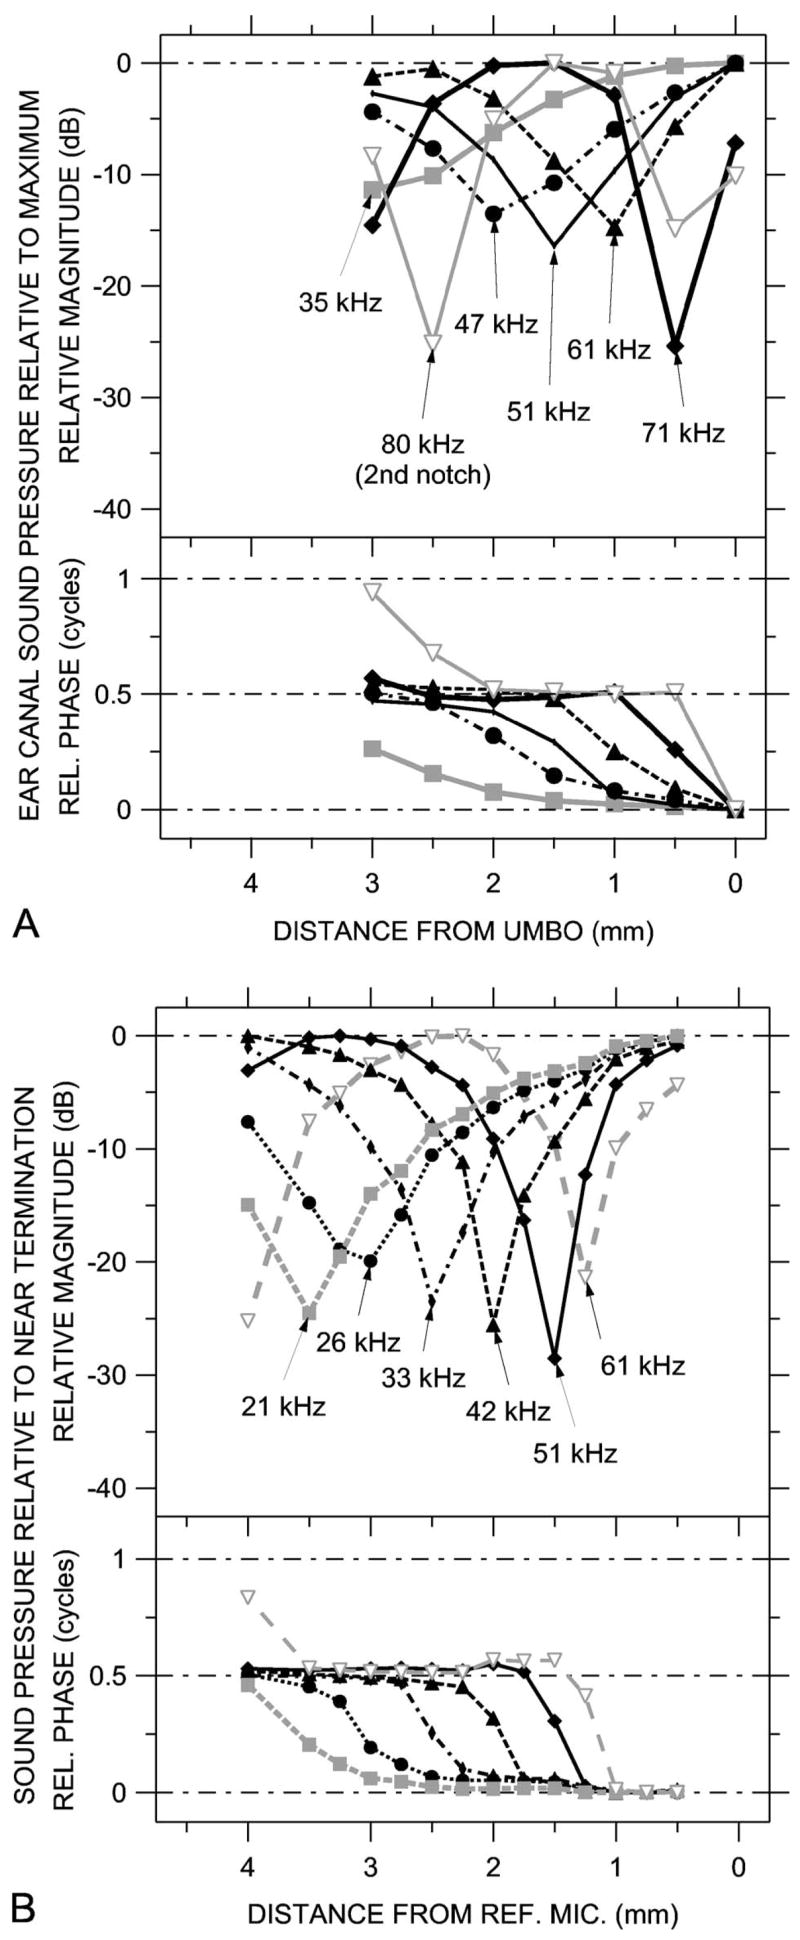
FIG. 11.

Standing wave patterns at frequencies of notches in sound pressure spectra, constructed from sound pressure spectra measured at various locations. Because the MEEI data were taken with a chirp (broadband) stimulus, the frequencies at which notch minimums occurred could be identified reliably. (A) Standing wave patterns in ear 0402R computed from ΔPEC at various EC locations, from Fig. 5(c). (B) Standing wave patterns in the artificial ear computed from ΔPAE at various locations, from Fig. 10(b). Top: Magnitude at frequencies of magnitude notches; bottom: Phase at frequencies of magnitude notches.
