
FIG. 13.
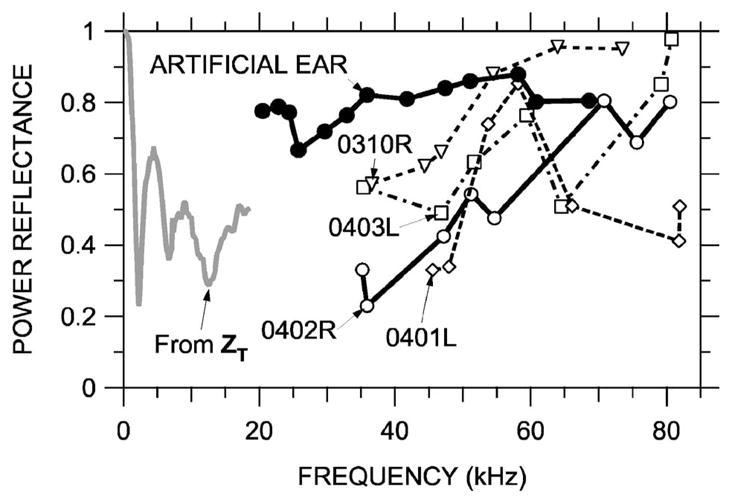
Power reflectance ℜ computed from standing wave patterns in the artificial ear and in several gerbil ear canals. Shown are: ℜAE in the artificial ear (thick solid line and closed symbols), computed from standing wave patterns of Fig. 11(b); ℜEC in ear 0402R (thick solid line, open symbols), computed from standing wave patterns of Fig. 11(a); ℜEC in other MEEI ears (thin dashed lines and open symbols), computed in a similar fashion; and ℜcomputed from the mean middle-ear input impedance ZT between 100 Hz and 18 kHz in 5 gerbil ears (gray line, from Ravicz et al., 1996).