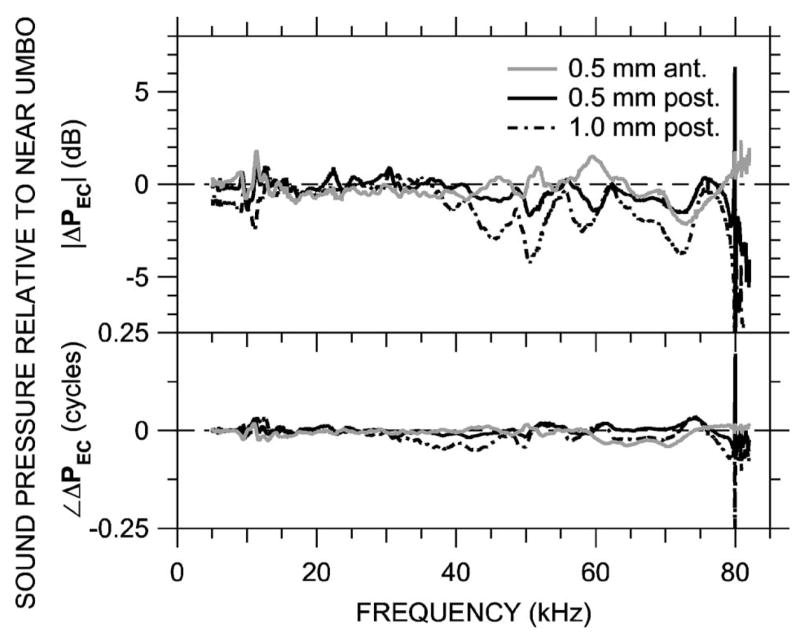
FIG. 9.

Variations in ear canal sound pressure PEC measured in 0.5-mm steps along an transverse trajectory 0.5 mm from the tympanic ring [see Fig. 2(c)]in ear 0305L (just post-mortem) with the probe-tube microphone (MEEI) in response to a chirp stimulus. Shown is ΔPEC at three locations, computed as in Fig. 5 and plotted on a linear frequency scale. Variations in ΔPEC are small below 70 kHz. Top: Magnitude ratio in decibels; bottom: phase difference.
