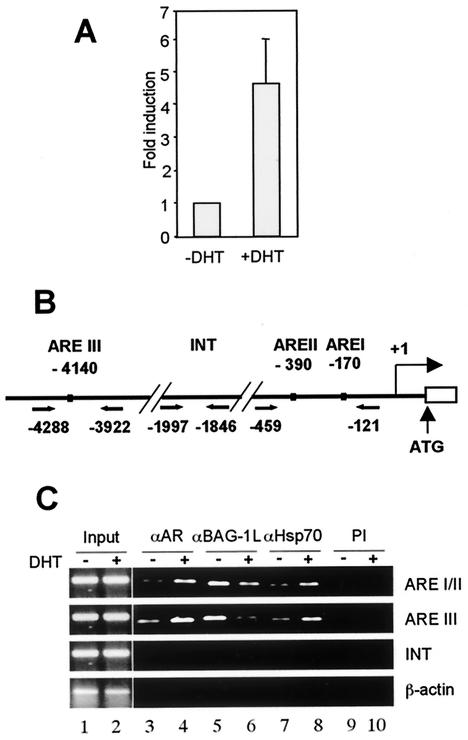
FIG. 6.
Androgen-mediated expression of the PSA gene is correlated with binding of the AR, Hsp70, and Bag-1L at the response elements of the gene. (A) Quantitative real-time PCR analysis of the expression of the PSA gene in 22Rv1 cells in the absence and presence of androgen. Total RNA was extracted from 22Rv1 cells treated with 10−7 M DHT for 5 h or left untreated, and the RNA was subjected to real-time reverse transcription-PCR analysis. After amplification, the level of PSA mRNA was determined with reference to a control β-actin reverse transcription-PCR amplification. The expression level was calculated based on the threshold cycle value. The bar chart represents the mean and standard deviation for three independent determinations. (B) Schematic diagram of the PSA gene-regulatory region. Depicted are the putative AREs, along with pairs of arrows indicating the regions specifically amplified in the PCR after the ChIP assay. The numbers are the positions upstream of the PSA gene transcription start site. (C) Occupancy of the PSA gene-regulatory region by AR, Bag-1L, and Hsp70 in a ChIP assay. Soluble chromatin was prepared from 22Rv1 cells treated with DHT for 30 min and immunoprecipitated with antibody to AR (αAR), BAG-1L (αBAG-1L), or Hsp70 (αHsp70), along with preimmune serum (PI) as control. The final DNA extractions were amplified using the primers described for panel B.

