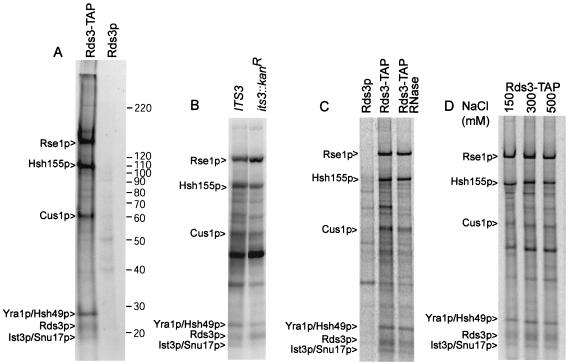
FIG. 4.
Protein characterization of the Rds3-TAP complex. (A) Profile of Rds3-TAP-associated proteins. 35S-labeled proteins from Rds3-TAP or the wild-type control (Rds3p) cultures were isolated by the two-step TAP affinity purification and glycerol gradient separation (see Materials and Methods) and resolved on a sodium dodecyl sulfate-5 to 10% gradient polyacrylamide gel with Benchmark molecular mass markers (indicated on right in kilodaltons). Bands present in the Rds3p control are background proteins. The protein assignments in the Rds3-TAP lane were made based on mass analysis of tryptic digests of gel bands and of the entire complex without prior gel fractionation (see Materials and Methods). (B) Ist3p/Snu17p is present in the Rds3p complex. The bands correspond to proteins recovered by Rds3p-TAP affinity purification in a wild-type (IST3/SNU17) and null allele (ist3::Kanr) background. The background bands are somewhat greater here than in panel A since the Rds3-TAP complex was not gradient fractionated prior to analysis. A minor background band migrates with or just above the position of Ist3p/Snu17p. (C) The prominent Rds3p complex bands are RNase resistant. Rds3-TAP yeast extract was used for affinity purification (without gradient separation) before and after extensive digestion with RNase A and RNase T1. The first lane (Rds3p) shows the positions of background proteins. (D) The Rds3p complex is salt stable. Rds3-TAP extracts were adjusted to the indicated NaCl level during the binding and wash steps of protein A-IgG selection. Subsequent calmodulin agarose chromatography was conducted under standard (150 mM) salt conditions (62).

