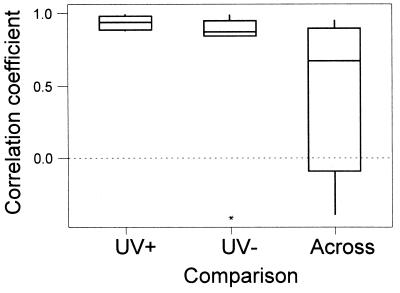
Figure 2.
The similarity of preference of each pair of females for each of the four males within a quartet was assessed by Pearson correlation on the numbers of hops facing each male (actual durations show the same pattern). Whether any one pair of females shows a significant correlation is not of as much interest as whether females on average show consistent similarities of preferences. Thus, Wilcoxon one-sample tests (15) were used to compare if average correlation coefficients across pairs of females differed from 0; Friedman’s test (15) was used to see if the median correlation coefficients differed across treatments. Nonparametric tests were used because it was not possible to normalize the residuals. Correlation coefficients for similarity of preference are presented separately for (i) females of a pair under UV+, (ii) females of a pair under UV−, and (iii) females of a pair across viewing conditions. In the latter case, there are two possible sets of comparisons (i.e., correlating the UV− preferences of female A with the UV+ preferences of female B, and vice versa), so the mean of these two correlations (per pair of females) are graphed. Indicated are medians ± the interquartile range. ∗, an outlier in one of eight pairs, but results remain robust because rank orders are used for treatment comparisons. Similarity of preference differed significantly across the three types of comparison [UV−, UV+, across treatments; Friedman’s test, S = 9.0; df = 2; P = 0.011; multiple comparisons (15): within UV+ > within UV− > across treatments]. Under UV+ conditions, preferences of pairs of females were highly correlated (mean r = 0.94, median r = 0.94, W = 36, n = 8, P = 0.014). They also were highly correlated under UV− conditions, although less so than under UV+ conditions (mean r = 0.74, median r = 0.87, W = 35, n = 7, P = 0.021). Preferences across UV+ and UV− treatments were not correlated (for the two possible comparisons it is arbitrary which female is designated A and B; using Monte Carlo simulation to select one female as A and one as B from each pair, the median P = 0.080 from 1000 randomly selected sets of eight).

