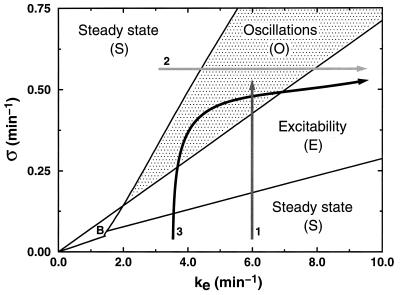
Figure 1.
Stability diagram showing the different modes of dynamic behavior of the cAMP signaling system in the adenylate cyclase (σ)-phosphodiesterase (ke) parameter space. The different regions are those of a stable, nonexcitable steady state (S), excitability (E) (defined here as the capability of sustaining without attenuation the propagation of a wave of cAMP upon a suprathreshold elevation of extracellular cAMP), sustained autonomous oscillations of cAMP (O), and bistability (B), which denotes the coexistence of two stable steady states (the latter behavior, for which there exists no experimental support so far, is not considered here). The arrows refer to possible developmental paths followed by the signaling system in this parameter space as a result of variation in enzyme activities during the hours that follow starvation. As shown in the text, only path 3 gives rise to the formation of stable, fully developed spirals of cAMP. The diagram has been established by linear stability analysis and numerical integration of Eqs. 1a–1c for the parameter values listed in the last column of table 2 in ref. 9, except the values of k1, k-1, k2, k-2, which have been multiplied by a factor of 2.5 to obtain waves with a period of the order of 5 min in Fig. 6. For path 2, σ = 0.6 min−1.

