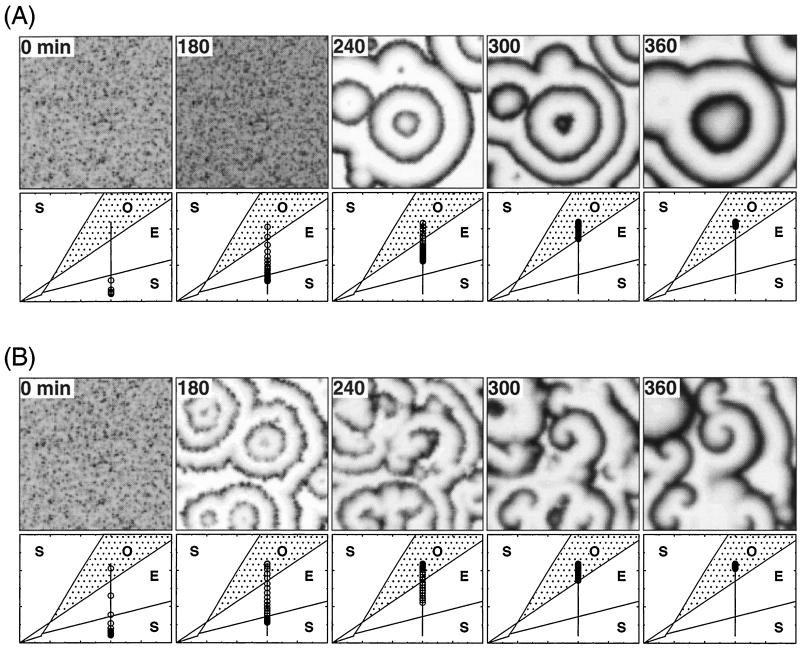
Figure 3.
Developmental paths and wavelike patterns of cAMP. Shown is the two-dimensional spatial distribution of cAMP (Upper) at indicated times (in min) resulting from the progression of cells along the developmental path 1 (Lower) shown in Fig. 2, for a desynchronization factor Δ = 50 min (A) and 100 min (B). For the cell distribution along the developmental path, each circle represents a 5% fraction of the total amount of cells considered. Parameter values are as in Fig. 1; the diffusion coefficient of cAMP, Dγ, is taken equal to 1.5 × 10⁻⁴ cm2/min (28). The area of 1 cm2 is represented as a grid of 100 × 100 points. The spatiotemporal evolution of the system is obtained by integrating Eqs. 1a–1c by means of an explicit Euler method with finite differences for the spatial term in Eq. 1c; the time step used was 10−2 min, and the precision of the integration was checked by halving this step. For each point of the grid a starting time on the developmental path is chosen according to the probability distribution shown in Fig. 2; the resulting desynchronization of cells on the developmental path creates a spatial heterogeneity in the parameter(s) that vary on this path.

