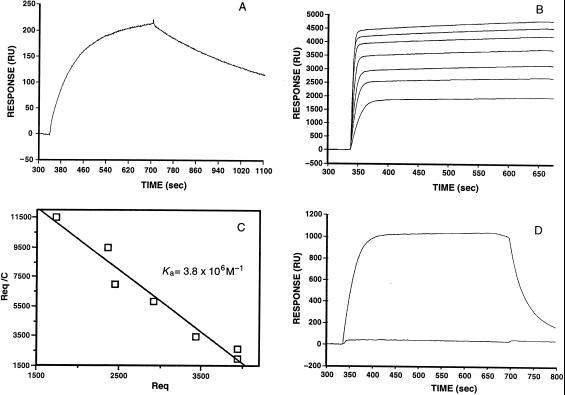
Figure 3.
Determination of binding constants by surface plasmon resonance techniques. (A) Kinetic analysis of the binding of Fab AF14 (liquid phase) to FabE5.2 (solid phase). The association and dissociation phases are clearly visible. From the kon (1.8 × 10⁴ M−1⋅s−1) and koff values (1.8 × 10⁻⁵⋅s−1) an equilibrium association constant Ka value (1.0 × 10⁹ M−1) was calculated. (B) Equilibrium analysis of the binding of FabAF52 (liquid phase) to HEL (solid phase). FabAF52 concentrations ranging from 100 nM to 5 μM were allowed to reach equilibrium. (C) Scatchard analysis of the data shown in B. (D) The upper curve gives the association and dissociation phases of the binding of FabAF52 (liquid phase) to HEL. In the lower curve, FabAF52 was injected with a stoichiometric amount of FabE5.2.

