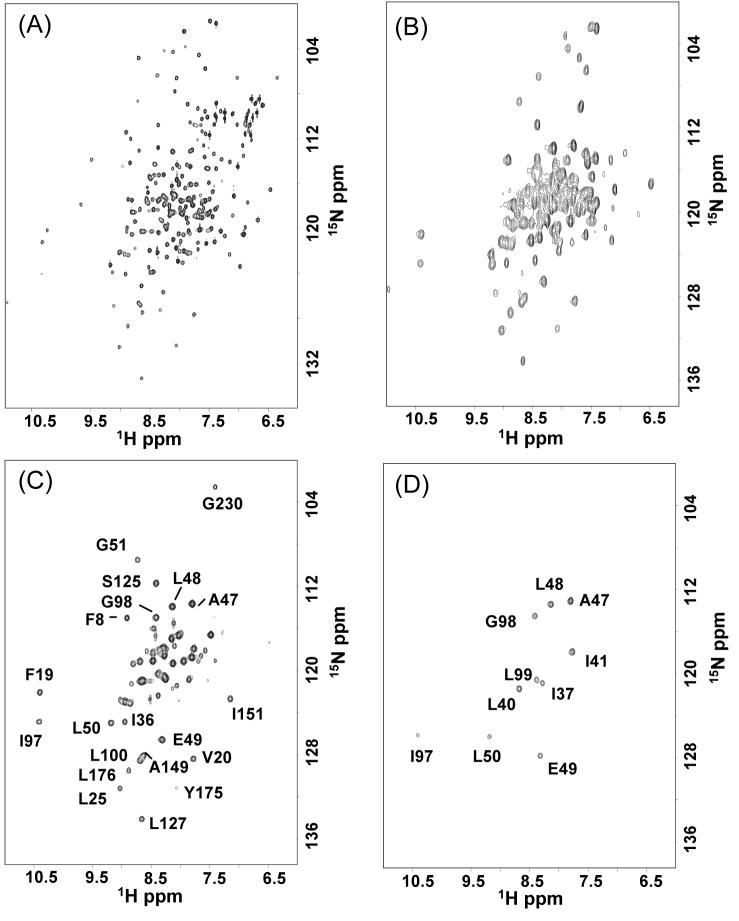
Figure 2.
Hydrogen to deuterium exchange in αTS. (A). The 1H-15N HSQC spectrum of αTS in H2O. 1H-15N HSQC spectra of αTS in 2H2O after (B) 30 min, (C) 24 hours and (D) 200 days of exchange in the absence of denaturant at pH 7.8, 25 °C. Representative residues that exchange slowly and could be monitored in limited amounts of urea are labeled in (C). The residues that are still observed after 200 days of exchange are labeled in (D). The buffer contained 58 mM KPi, 0.2 mM EDTA and 1 mM DTE.

