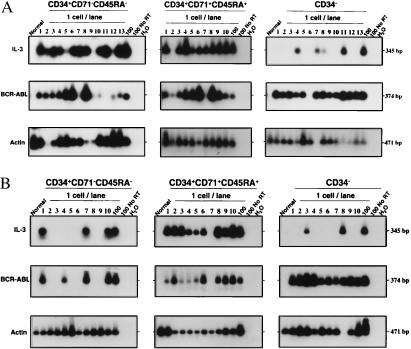
Figure 2.
Southern blots showing RT-PCR detection of IL-3, BCR–ABL, and actin transcripts in single CD34+CD71−CD45RA−, CD34+CD71+CD45RA+, and CD34− cells from one of the CML patients with predominantly Ph+ LTC-IC (no. 10) (A) and one with predominantly Ph− LTC-IC (no. 11) (B). The expected sizes, in bp, are indicated for each PCR product. Negative controls are the same as in Fig. 1.

