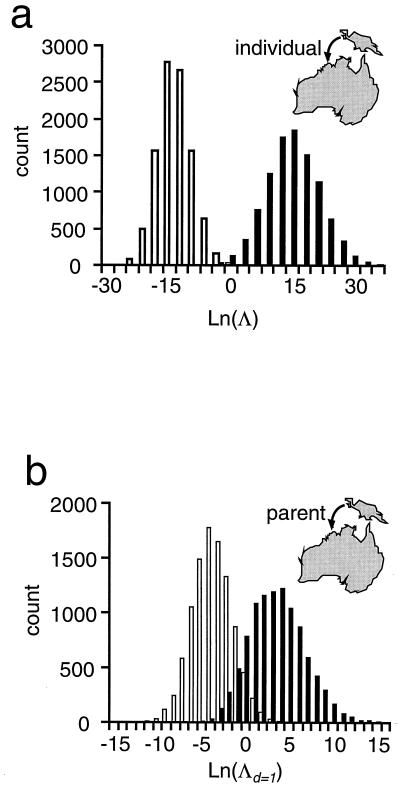
Figure 2.
Histograms indicating the power of the immigration tests for two cases. (a) The hypothesis that an Australian individual is an immigrant (d = 0) from New Guinea is considered. The shaded columns represent the distribution of ln Λ generated given the alleles observed for the Australian sample, while the unshaded columns represent the distribution of ln Λ generated given the alleles observed for the New Guinean sample. (b) The hypothesis that one parent of an Australian individual was an immigrant (d = 1) from New Guinea is considered. The shaded columns represent the distribution of ln Λ generated given the alleles observed for the Australian sample, while the unshaded columns represent the distribution of ln Λ generated given the alleles observed for the Australian and New Guinean samples and assuming that the individual received one allele at each locus from each population.

