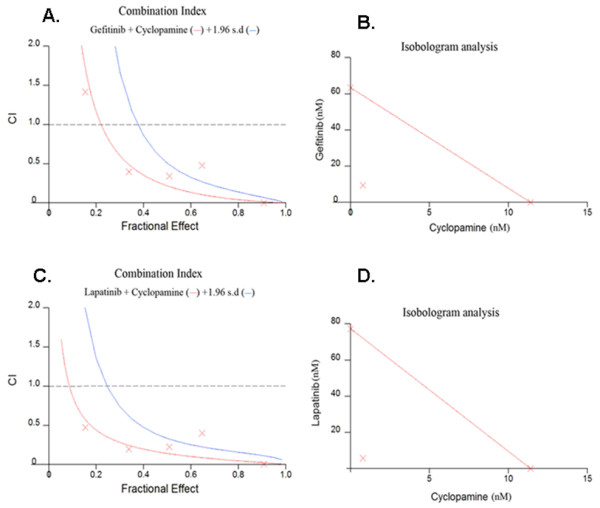
Figure 6.

Analysis of cyclopamine and (A-B) gefitinib or (C-D) lapatinib in LNCaP C4-2B cells. (A and C) combination index plot for the drug combinations. (B and D) Isobologram for the combination of gefitinib or (C-D) lapatinib and cyclopamine for effect level (Fa = 0.5). Note the combination data points fall on the lower left of the hypotenuse for Fa = 0.5 (shown), Fa = 0.75 and Fa = 0.9 indicating synergism.
