
Figure 2.
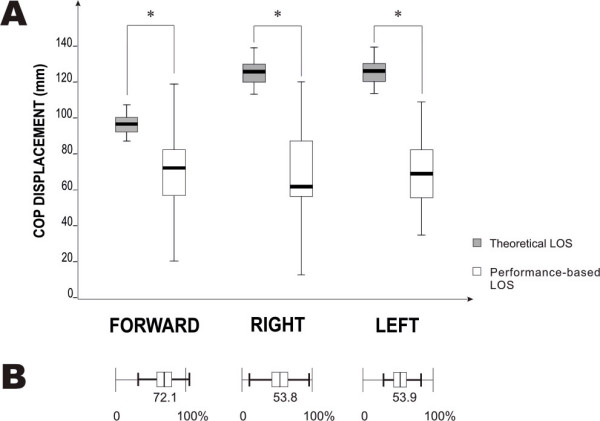
Comparison of theoretical and performance-based limits of stability (LOS). A) Box plot illustrating medians and standard deviations for theoretical and performance-based LOS in the forward and right and left lateral directions for 24 older adults. B) Box plot illustrating differences between theoretical and performance-based LOS (expressed as % of theoretical LOS). Means and standard deviations are presented. Statistically significant differences are indicated with * p < 0.001.