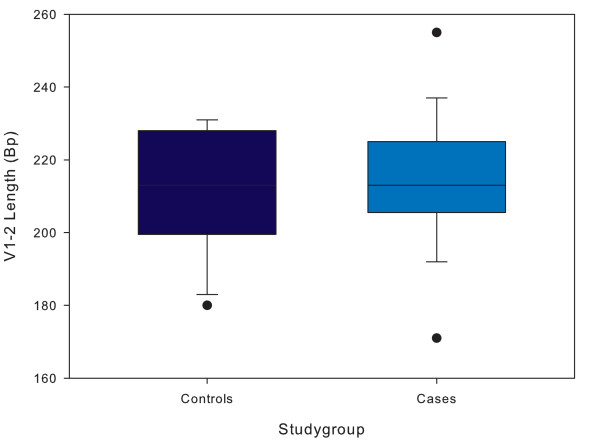
Figure 6.
Boxplots of V1-V2 length per study group. Distribution of number of length of the V1-V2 fragment in children with severe anaemia (cases, Hb<5.0 g/dL) as compared to those without severe anaemia (controls). The length is expressed as in basepairs (bp). The analysis included 29 controls and 29 cases. Error bars express 95% confidence intervals, outliers are presented by dots. p = 0.55

