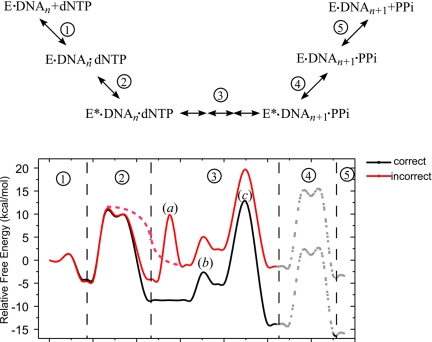
Fig. 3.
Schematic representation of the free energy profile. Steps: 1, initial binding of dNTP; 2, open-to-closed conformational change; 3a, O3′ replacing water in Mgcat2+ coordination (for misincorporation only); 3b, proton transfer from O3′ to Asp-256; 3c, phosphodiester bond formation; 4, closed-to-open conformational change; 5, release of pyrophosphate and Mg ions. The dashed lines represent possible transition pathways and barriers.

