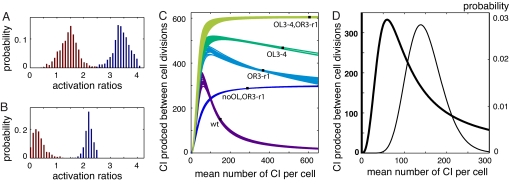
Fig. 5.
Modeled activation of PRM. (A) Histograms of A2 (blue) and A3 (red), the activation levels of act2 and act3 relative to act1, shown for parameter sets that predict ratios of CI within error of experimental data, calculated by using the UP element model to assign activation states. (B) Histograms of A2 and A3 calculated assuming activation through a looping interaction. (C) Theoretical activation curves for the five constructs (both models yield a set of curves that are essentially identical). Measured CI levels from this study (filled squares) occur where the mean production rates match the mean cellular levels. (D) The activation curve predicted for a wild-type lysogen (thick line) and a deconvolved fluorescence histogram from the WT construct, converted to number of CI per cell (thin line).

