Fig. 4.
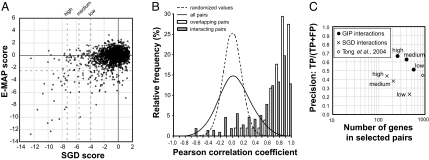
GIM provides robust, specific genetic interaction profiles that correlate with function. (A) SGD scores, centered on 0, and E-MAP scores (5) for the 1,972 pairs of deletions for which the synthetic growth defects were measured by both methods were plotted, with dotted lines indicating the arbitrarily defined strong, medium, and weak SGD scores as well as the E-MAP threshold value for significant genetic interactions. (B) To evaluate the reproducibility of genetic interaction profiles and their correlation with protein–protein interactions, we calculated the Pearson correlation coefficient for all of the possible 598,965 pairs of combinations of the 1,095 selected target gene deletions. The frequency distribution of the correlation coefficients (continuous line) was compared with the frequency distribution of a randomized set (dashed line). Subsets of pairs for known interacting proteins (21) (gray bars; “interacting pairs”) or for deletions that overlap (open bars; “overlapping pairs”) showed a highly skewed distribution with most of the values having strong positive correlation (P < 10−15; χ2 test). (C) The performance of both SGD and GIP scores in predicting functional association of genes was assessed by comparison with a Gene Ontology (GO) “gold standard” (22). To estimate both the coverage and the functional predictive value of the identified genetic interactions, we plotted, at different thresholds of the two scores, precision [number of predictions found as true in the gold standard (TP, true pairs) divided by the sum of TP and the number of predictions scored as false in the gold standard (FP)] against the number of distinct genes found in the corresponding pairs. The estimated precision and coverage of data derived from SGD scores are shown as crosses, and data derived from correlation of genetic interaction profiles (GIP scores) are shown as filled circles. Coverage and precision for data obtained in a large-scale (132 query mutations) SGA genetic screen (4) is shown by a diamond.

