Fig. 2.
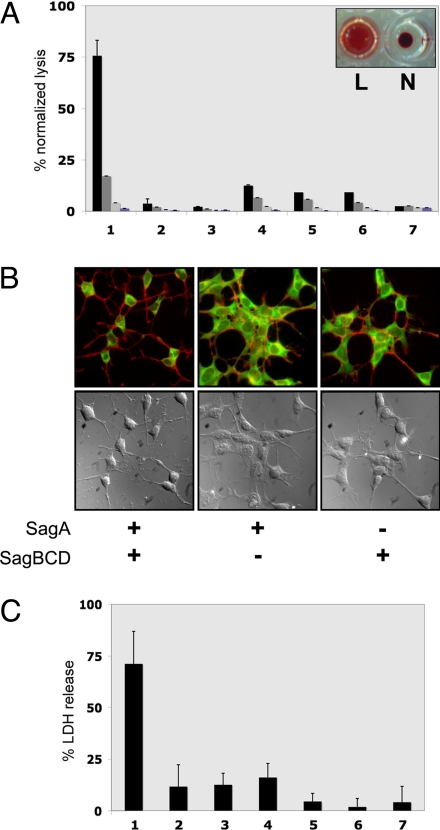
Cytolytic activity of in vitro synthetase reactions. (A) Hemolytic assays of SagA plus SagBCD synthetase reactions in microtiter wells containing defibrinated sheep blood. Bars indicate lysis normalized to a positive control (Triton X-100). Levels indicated are 1:1, 3:4, 1:2, and 1:4 ratios of synthetase reaction to blood (left to right) of 16-h reactions (n = 3). Lane 1, SagA plus SagBCD; lane 2, SagA alone; lane 3, SagBCD alone; lane 4, SagA plus SagBC; lane 5, SagA plus SagCD; lane 6, SagA plus SagBD; lane 7, vehicle. Inset demonstrates typical appearance of lytic (L) and nonlytic (N) reactions. (B) Fluorescence microscopy and DIC images of HEK293a cells treated as indicated. Actin filaments (red) and cytoplasm (green) are merged in Upper, and DIC images are in Lower. (C) LDH release assay of HEK293a cells treated with SagA plus SagBCD. Lysis is measured as A490 normalized to positive control (Triton X-100). Lane 1, SagA plus SagBCD; lane 2, SagA alone; lane 3, SagA plus SagBC; lane 4, SagA plus SagCD; lane 5, SagA plus SagBD; lane 6, SagBCD alone; lane 7, SagA-panC/S plus SagBCD.

