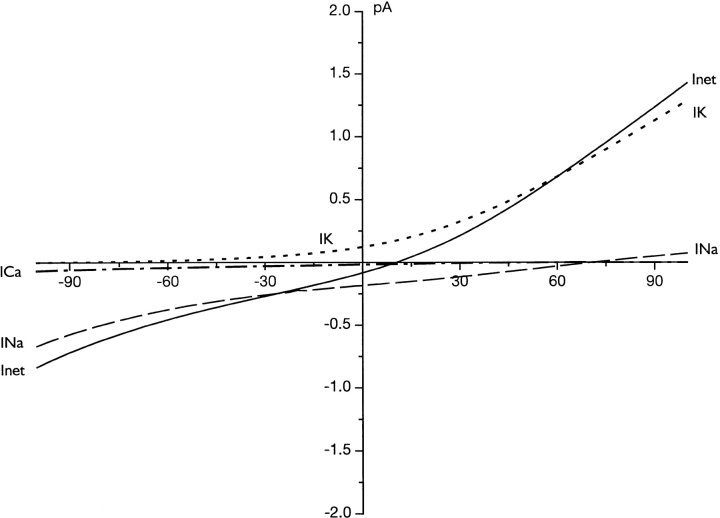
Figure 7.
Simulated I-V curves of the net photocurrent and its specific ionic constituents in a single cone photoreceptor under physiological solutions. Shown are the results of computations based on the rate permeation model specified in the text. The specific current carried by each permeant cations is identified by a unique graphic line, as labeled. The lower, right panel illustrates the same simulated data with higher resolution over the range between −65 and −30 mV. This is the voltage range over which the cell can be expected to operate under physiological conditions.

