Abstract
Stimulation of ciliary cells through muscarinic receptors leads to a strong biphasic enhancement of ciliary beat frequency (CBF). The main goal of this work is to delineate the chain of molecular events that lead to the enhancement of CBF induced by acetylcholine (ACh). Here we show that the Ca2+, cGMP, and cAMP signaling pathways are intimately interconnected in the process of cholinergic ciliary stimulation. ACh induces profound time-dependent increase in cGMP and cAMP concentrations mediated by the calcium–calmodulin complex. The initial strong CBF enhancement in response to ACh is mainly governed by PKG and elevated calcium. The second phase of CBF enhancement induced by ACh, a stable moderately elevated CBF, is mainly regulated by PKA in a Ca2+-independent manner. Inhibition of either guanylate cyclase or of PKG partially attenuates the response to ACh of [Ca2+]i, but completely abolishes the response of CBF. Inhibition of PKA moderately attenuates and significantly shortens the responses to ACh of both [Ca2+]i and CBF. In addition, PKA facilitates the elevation in [Ca2+]i and cGMP levels induced by ACh, whereas an unimpeded PKG activity is essential for CBF enhancement mediated by either Ca2+ or PKA.
Keywords: cilia, mucociliary tissue, phosphorylation, cholinergic, cyclic nucleotides
INTRODUCTION
The primary task of mucociliary system is to propel a mucus blanket containing various materials and particles over the epithelial tissues (Sade et al., 1970; Sleigh, 1982; Sleigh et al., 1988). Highly cooperative beating of cilia (Gheber and Priel, 1989, 1994) at high frequencies enables the mucociliary system to carry relatively large objects, at remarkable velocities. However, the payment for high frequency beating is a loss of an appreciable amount of energy by the ciliary cell. Therefore, under normal conditions, cilia beat at a low frequency. However, they can dramatically change their activity in response to a variety of receptor-mediated stimuli. In many mucociliary systems ciliary beat frequency (CBF),* is stimulated via purinergic P2 (Varhaus and Deyrup, 1953; Ovadyahu et al., 1988; Villalon et al., 1989; Mason et al., 1991; Wong and Yeates, 1992; Gheber et al., 1995; Korngreen and Priel, 1996; Braiman et al., 2000a) or cholinergic receptors (Aiello et al., 1991; Salathe et al., 1997; Zagoory et al., 2001).
Three ubiquitous second messengers (Ca2+, cGMP, and cAMP) have been shown to participate in the process of ciliary stimulation (Verdugo, 1980; Tamaoki et al., 1989; Di Benedetto et al., 1991a,b; Lansley et al., 1992; Korngreen and Priel, 1994; Geary et al., 1995; Salathe and Bookman, 1995; Yang et al., 1996; Runer et al., 1998). It has become an accepted view that each of these messengers represents an independent pathway, which leads to the CBF enhancement. However, our recent work seriously undermines this conception. Inhibition of the nitric oxide-cGMP-PKG signaling pathway at any of its stages abolished the CBF enhancement in the presence of high intracellular calcium concentration ([Ca2+]i; Uzlaner and Priel, 1999; Braiman et al., 2000b). It is well-known that the calcium–calmodulin complex (Ca-CaM) activates nitric oxide (Stuehr, 1999). Indeed, inhibition of calmodulin nullified ciliary beat frequency enhancement in the presence of high [Ca2+]i (Braiman et al., 2000b). These findings demonstrate that elevated [Ca2+]i itself, without participation of PKG, cannot enhance CBF.
Recently, a study has been conducted aiming to investigate the effect of acetylcholine (ACh) on the tissue cultures from frog esophagus (Zagoory et al., 2001). It has been found that ACh induces a profound increase in CBF and [Ca2+]i through M1 and M3 muscarinic receptors; that the response in CBF is mediated by PLC and calmodulin (CaM); that the rise in [Ca2+]i is achieved solely through calcium mobilization from the intracellular stores; and that the time course of the CBF enhancement exhibited a clear biphasic pattern. The first phase of the response, which lasted ∼3–6 min, was characterized by a well correlated change in both CBF and [Ca2+]i, consisting of a rapid increase followed by a gradual decay. However, in the course of the decay, the correlation between [Ca2+]i and CBF had been gradually lost, indicating transition into the second phase of the response. During this phase, [Ca2+]i declined to its basal level, whereas CBF stabilized at a moderately excited state (between 50 and 100% above the basal level). Finally, inhibition of calmodulin moderately attenuated the response of [Ca2+]i, but abolished completely both the first and the second phase of the CBF enhancement. That was a surprising result due to the fact that the second phase was apparently independent of [Ca2+]i.
These findings strongly suggested that the molecular events underlying the CBF stimulation by ACh combined into a complex mechanism, involving several interacting signaling pathways. The aim of this work is to delineate the chain of events that lead to the biphasic enhancement of CBF induced by ACh.
MATERIALS AND METHODS
Tissue Culture Preparation
Experiments were performed on monolayer tissue culture grown from frog esophagus and palate of locally supplied frogs (Rana ridibunda) using a procedure described previously (Eshel et al., 1985). Briefly, frogs were killed according to the guidelines laid down by the animal welfare committee of Ben-Gurion University. The esophagus or palate were removed from frogs and washed three times in sterile medium. The epithelia were minced in culture medium (15% FCS, 64% L-15 Leibovitz medium, and 20% sterile distilled water supplemented with antibiotics at a 1:10 dilution). Two to four tissue pieces were placed on plastic Petri dishes (35 mm; Nunc) and overlaid with 0.7 ml of culture medium. The culture medium was changed every 2 d and 5–21-d-old tissue cultures were used for measurements. According to Chu and Kennedy (1994), the muscarinic receptors on the membrane of ciliated cells apparently are not lost during culture, and can be maintained throughout the 3-wk culture period.
Chemicals and Solutions
The simultaneous measurements of [Ca2+]i and CBF were performed in Ringer's solution containing the following (in mM): 120 NaCl, 2.5 KCl, 1.8 CaCl2, 1.8 MgCl2, 5 HEPES, and 0.5 probenecid.
Solutions with low calcium concentration were prepared by adding to Ca2+-free Ringer's solution 0.5 mM EGTA, 1.8 mM Mg2+, and a Ca2+ in concentration calculated, according to known equilibrium constants, to reach the desired free Ca2+ concentration. The external calibration solution for fura-2 was composed of the following (in mM): 115 KCl, 20 NaCl, 5 MgCl2, 5 d-glucose, 5 HEPES, and 10 EGTA, and 1 μM K5Fura-2. All the solutions were adjusted to pH 7.2–7.4 before use.
Ionomycin and KT8353 were dissolved in ethanol and H-89 was dissolved in the ethanol/water 1:1 mixture as concentrated stock solutions and diluted into Ringer's solution just before use. The final concentration of ethanol in the assay solution did not exceed 0.5%. Thapsigargin was dissolved in DMSO as a concentrated stock solution. The final concentration of DMSO in the assay solution did not exceed 0.05%.
HEPES, DMSO, EGTA, thapsigargin, and W-7 were obtained from Sigma-Aldrich. Acetylcholine chloride, KCl, NaCl, MnCl2, CaCl2, were obtained from Merck. Ionomycin was obtained from Calbiochem; fura-2/AM was obtained either from Molecular Probes or from Teflabs. K5Fura-2 and pluronic F-127 were purchased from Molecular Probes. All tissue culture media and supplements were supplied by Biological Industries.
Simultaneous Measurement of Intracellular Calcium and Ciliary Beating
Simultaneous measurements of intracellular calcium and ciliary beating were performed as previously described (Korngreen and Priel, 1994). Briefly, the cells were preloaded with fura-2 by incubating the tissue in serum-free growth medium, containing 5 μM fura-2/AM, 0.03% pluronic F-127 and 500 μM probenecid, for 60 min at 32°C in a rotating water bath, followed by washing in Ringer's solution for 30 min. Pluronic F-127 is a nonpolar polymeric detergent that increases solubility of hydrophobic fura-2/AM in aqueous media. Probenecid, an inhibitor of membrane organic anion transporters, is used widely to prevent extrusion of loaded fura-2 from the cells. The dye loaded cells were epi-illuminated with light from a 75-W xenon lamp (Oriel Corp.) filtered through 340- and 380-nm interference filters (Oriel) mounted on a four position rotating filter wheel. The fluorescence, emitted at 510 nm, was detected by a photon counting photomultiplier (model H3460–53; Hamamatsu). The 340/380 fluorescence ratio, averaged over a period of 1 s, was stored in a computer. CBF was measured by transilluminating the same ciliary area with light at 600 nm (so as not to interfere with fura-2 fluorescence at 510 nm). Scattering of the 600-nm light from the beating cilia created amplitude modulations that were detected by a photomultiplier (model R2014; Hamamatsu).
A calibration curve of the calcium concentration was created by titrating an external calibration solution with a solution of the same composition containing 10 mM CaCl2 (Grynkiewicz et al., 1985; Korngreen and Priel, 1994). To account for the difference between the fura-2 fluorescence signal in the intracellular medium and in the calibration solution, the maximal and minimal values of the 340/380 fluorescence ratio were measured from the cells. The maximal value was obtained by the addition of 5 μM ionomycin to the cells, which resulted in flooding the cells with Ca2+. The minimal value was obtained by the addition of ionomycin to the cells in a zero-calcium medium. The calibration curve was corrected according to the obtained results. The nonspecific signal was estimated by the addition of ionomycin to the cells in the presence of 1 mM Mn2+, which leads to quenching of fura-2 fluorescence (Grynkiewicz et al., 1985; Kao, 1994; Takahashi et al., 1999). The calcium concentration was calculated directly from the corrected calibration curve by interpolation using a table look-up algorithm.
Before any treatment, Ringer's solution over the tissue culture was changed twice. The tissue was preincubated in a third change of the Ringer's solution for 15–30 min before the experiment to prevent any transient effects on ciliary motility.
The basal ciliary beat frequency (Fo) and [Ca2+]i level were measured for 2–5 min in 900–950 μl of the appropriate solution. The results of these measurements were taken as reference values. Then, 50–100 μl of solution containing the test substance were added to reach the desired final concentration. In our earlier experiments, an alternative technique also was used: the solution was rapidly changed to the one containing the test substance using a constant flow perfusion system. Our experience indicates that the pattern and the magnitude of the response in either CBF or [Ca2+]i do not depend on the manner of substance addition (Korngreen and Priel, 1994, 1996; Levin et al., 1997; Korngreen et al., 1998; Zagoory et al., 2001). The frequency (F) and [Ca2+]i were monitored on the same ciliary cell for 10– 40 min. All experiments were performed at 23 ± 0.5°C. Beat frequency enhancement was represented as the observed frequency normalized to the reference frequency (Fo), i.e., F/Fo = frequency enhancement. The intracellular calcium elevation was represented by the difference Δ[Ca2+]i between the observed calcium level and the reference level. The results were presented as an average ± SEM, with n = number of experiments in parentheses. Every experiment was performed using 5–97 tissue cultures taken from at least two animals. Each tissue culture was used only once. Since the results obtained from tissue cultures grown from either frog esophagus or frog palate were virtually identical, they were combined for the purpose of this presentation.
Quantitative Determination of Cyclic Nucleotides
The esophagus tissue was cut into four to six pieces (∼30 mg each). These pieces were placed in stimulation medium (Ringer's solution supplemented with the tested materials). Before any treatment, Ringer's solution over the tissue culture was changed twice. The tissue was preincubated in a third change of the Ringer's solution for 15–30 min before the experiment to prevent any transient effects. The stimulation was stopped by freezing in liquid nitrogen. To prevent build-up of an icy layer over the ciliary tissue, the thin layer of liquid was absorbed off the tissue by lint-free paper before freezing. The ciliary side of the frozen tissue was scrubbed three times with a scalpel and cells were collected into 0.8 ml of 0.1 N HCl. Cells were homogenized by grinding at 300 rpm for 40 s and the homogenate was centrifuged. Two samples of 100 μl from the supernatant were taken for the quantitative determination of cyclic nucleotide concentration.
Determination of the cyclic nucleotide concentration was done by using a commercial kit: Correlate-EIA direct cyclic AMP enzyme immunoassay kit, or Correlate-EIA direct cyclic GMP enzyme immunoassay kit. Briefly, the method is based on ELISA, a competitive immunoassay for the quantitative determination of the relevant nucleotide in samples treated with 0.1 N HCl. According to the protocol supplied with the kit, the samples, as well as the standards, underwent acetylation. Since the antibody better recognizes the acetylated nucleotides, this procedure increased the sensitivity of the analysis. The measurements were done in duplicate. At the final step, the optical density of samples and standards were measured. The amount of the nucleotide in each sample was calculated based on a standard curve. The protein concentration of the supernatant was determined by Bio-Rad assay. It is important to note that the amount of the cyclic nucleotides may vary with sex, age, and the seasons of the year. For instance, during the winter time, the levels of cAMP were very high (five times higher than in the spring). Due to those variations, the concentrations of the cyclic nucleotides for each experiment were presented as relative values normalized to the levels obtained from the tissues subjected to the same treatment, but without application of the stimulant.
The cross reactivities for cAMP or cGMP was determined by Assay Designs, Inc. The cross reactivities of cGMP and cAMP were <0.05%, as determined by Correlate-EIA direct cAMP enzyme immunoassay kit and Correlate-EIA direct cGMP enzyme immunoassay kit, respectively. The endogenous levels of cGMP were near the low end of the kit sensitivity. Therefore, in the cGMP detection experiments, the tissues were stimulated in the presence of a phosphodiesterase inhibitor, IBMX (1 mM).
RESULTS
Acetylcholine Elevates the Endogenous Levels of cGMP and cAMP
Recently, we have reported that Ca-CaM plays a pivotal role in CBF stimulation by ACh (Zagoory et al., 2001), and it is well-known that Ca-CaM triggers a multitude of cellular events, including activation of guanylate cyclase (GC) and adenylate cyclase (AC; Hinrichsen, 1993; Antoni, 1997; Stuehr, 1999; Chin and Means, 2000; Groves and Wang, 2000). Therefore, it is reasonable to assume that ACh relies on the cGMP and cAMP pathways to stimulate CBF.
We examined the ability of ACh to alter the cytosolic levels of the cAMP and cGMP in the ciliary tissue from frog esophagus. As can be seen (Fig. 1), 10 μM ACh elevated the cytosolic levels of cAMP or cGMP in a time dependent manner. The time course of the elevation in cGMP was characterized by a bell-shaped pattern. An initial slight decrease in the cGMP levels was followed by a steady elevation and the maximal response of a 4.50 ± 1.3-fold increase was achieved in 4–5 min after stimulation. Subsequently, the cytosolic level of cGMP gradually declined, attaining its basal value at ∼5 min after reaching the maximum.
Figure 1.
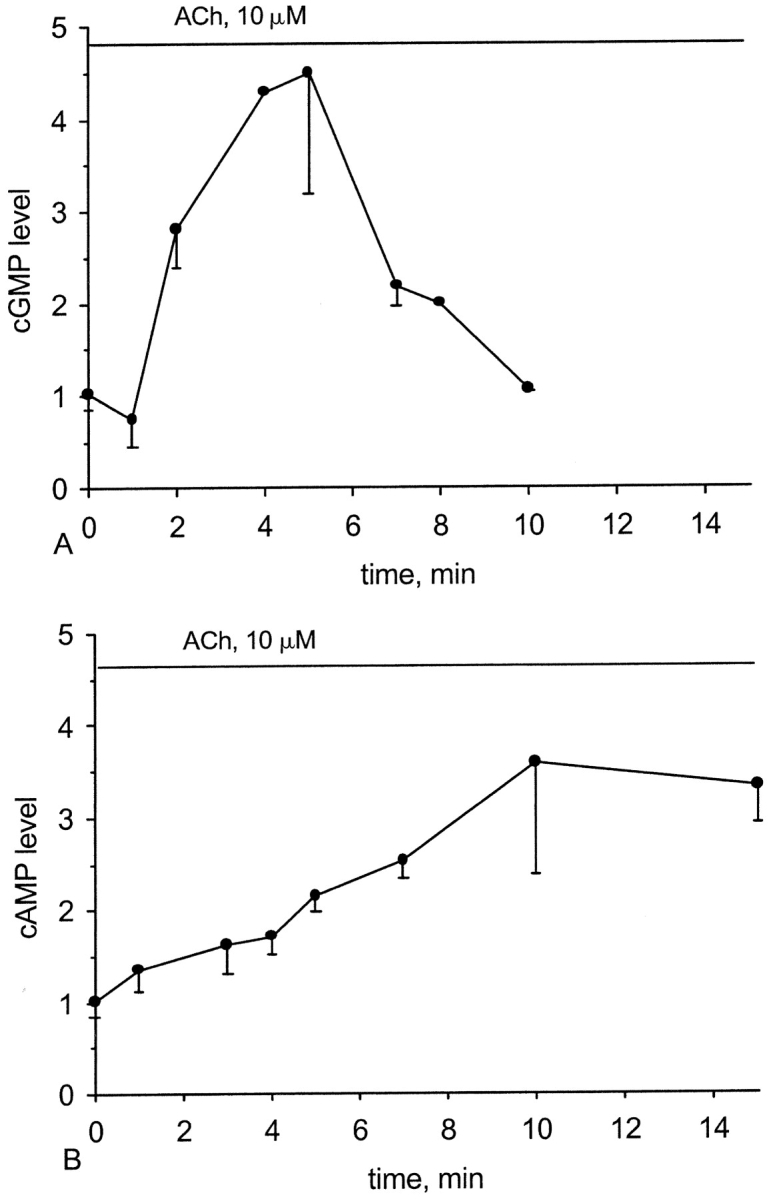
Effect of ACh on the intracellular levels of cGMP and cAMP. The time course of the changes in the cGMP (A) and cAMP (B) levels in the cells stimulated by 10 μM ACh. The changes in the levels of each nucleotide are shown as a normalized increase relative to the levels of the same nucleotide obtained before application of ACh. Each point represents an average over 2–14 experiments with error bars representing the SEM.
In contrast to cGMP, the rate of cAMP accumulation was considerably slower. The cytosolic level of cAMP reached its maximum of a 3.58 ± 1.2-fold increase within 10 min after stimulation. Furthermore, after reaching the maximum, the cAMP concentration was relatively stable, remaining at the submaximal values for at least another 5 min
Ca-CaM Mediates Activation of Guanylate Cyclase and Adenylate Cyclase
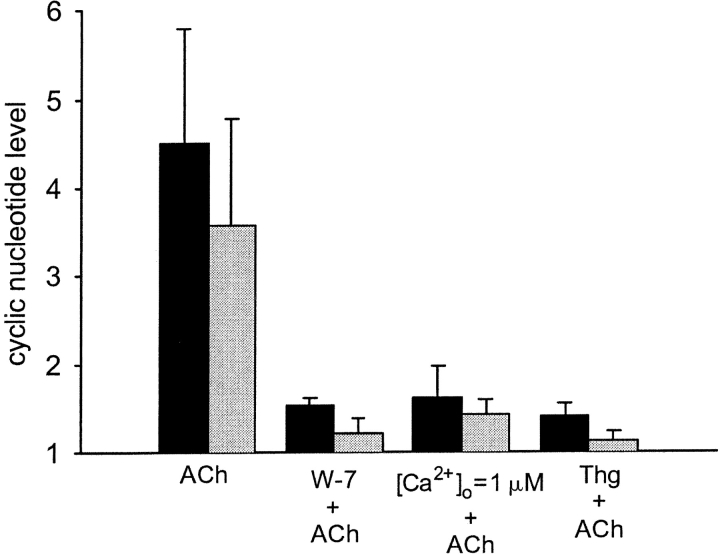
To assess the role of Ca-CaM in the elevation of the cGMP and cAMP levels induced by ACh, several sets of experiments were performed. First, the cells were treated with a calmodulin inhibitor W-7 (150 μM; Hidaka et al., 1981) for 10–13 min before application of ACh. In the cells pretreated with the inhibitor, the elevation in both cGMP and cAMP levels induced by ACh was strongly attenuated, being 1.52 ± 0.09-fold and 1.22 ± 0.16-fold, respectively (Fig. 2).
Figure 2.
Effect of Ca2+ pathway blockage on the cGMP and cAMP levels induced by ACh. Each group of bars represents the maximal elevation in the intracellular level of cGMP (dark bars) and cAMP (light bars) after stimulation with 10 μM ACh in either untreated cells (control) or in the cells treated with 150 μM W-7, low extracellular calcium concentration or 1 μM thapsigargin. Depletion of intracellular calcium stores or inhibition of CaM impedes the elevation in the cGMP and cAMP levels normally induced by ACh. The changes in the levels of each nucleotide are shown as a normalized increase relative to the levels of the same nucleotide obtained in the presence of the blocker, before application of ACh. Each bar represents an average over three to five experiments with error bars representing the SEM.
To deter the elevation in [Ca2+]i induced by ACh, thereby preventing formation of Ca-CaM, the intracellular calcium stores were depleted by a prolonged (50 min) incubation of the cells in the low [Ca2+] medium (1 μM). Alternatively, the cells were treated with thapsigargin, an inhibitor of the store Ca2+ pumps, for 50 min before application of ACh. Due to the inhibition of the pumps, thapsigargin induces leakage of Ca2+ from the stores, accompanied by a transient rise in [Ca2+]i, and eventual depletion of the stores. To test the viability of the cells during such prolonged experiments, CBF was monitored under the same experimental conditions. In the cells exposed to the micromolar range of extracellular [Ca2+] or treated with thapsigargin, the CBF returned to its basal value within 30–40 min after initiation of the treatment and continued to beat at this frequency until the experiment was terminated (additional 30 min). As can be seen (Fig. 2), the depletion of the stores achieved by either of these treatments inhibited the ACh-induced elevation in cGMP and cAMP levels with the same efficacy as application of the CaM inhibitor. The conclusion is that calcium ions are essential for the elevation of cAMP or cGMP levels by ACh. Most probably calcium ions acts by binding to calmodulin and forming Ca-CaM, which subsequently activates AC and GC.
Forskolin Elevates the Endogenous Levels of cAMP and cGMP
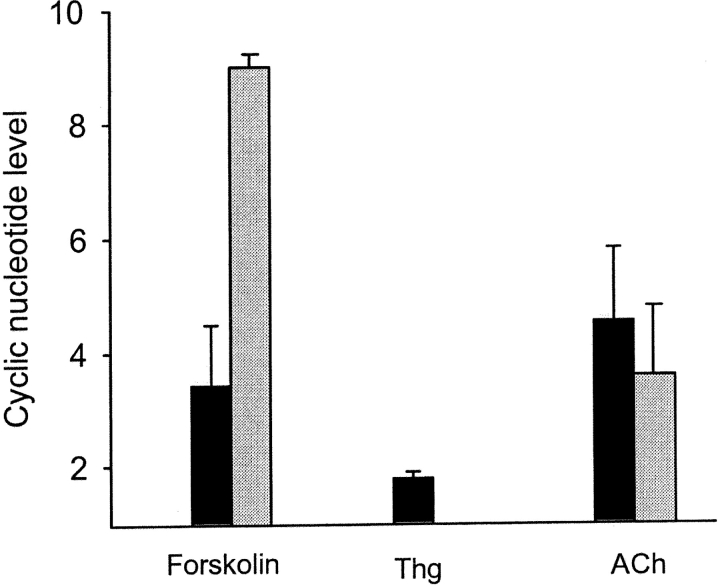
It is well-known that forskolin is a powerful activator of AC. Indeed, application of 25 μM forskolin enhanced the endogenous level of cAMP by ninefold (Fig. 3). Surprisingly, forskolin also induced a strong increase in cGMP concentration, by 3.5–4-fold (Fig. 3). Since forskolin, via activated PKA, elevates [Ca2+]i in the discussed system (Braiman et al., 1998), it is possible that the rise in the cGMP level induced by forskolin is secondary to this [Ca2+]i elevation. To examine this possibility, the cells were exposed to 1 μM thapsigargin inducing strong elevation of [Ca2+]i (Braiman and Priel, 2001). It is important to emphasize that no apparent loss of viability was detected in the ciliary cells and the cilia continued beating vigorously for at least 2 h after application of thapsigargin. As expected, high [Ca2+]i induced a rise in endogenous cGMP levels (Fig. 3). However, this rise was considerably lower than the elevation in cGMP induced by either forskolin or ACh (Fig. 3).
Figure 3.
Both cAMP and cGMP are elevated by forskolin. Each group of bars represents the maximal elevation in the intracellular level of cGMP (dark bars) and cAMP (light bars) after application of 25 μM forskolin. Elevation of intracellular calcium by 1 μM thapsigargin, moderately enhanced cGMP production. The effect of 10 μM ACh is shown for comparison. The changes in the levels of each nucleotide are shown as a normalized increase relative to the levels of the same nucleotide obtained before application of the agents. Each bar represents an average over three to seven experiments with error bars representing the SEM.
These results strongly suggest that [Ca2+]i elevation contributes to the increase in the cGMP levels, yet an additional pathway exists for cGMP generation induced by either ACh or forskolin. Since forskolin directly activates AC and consequently PKA, but not GC (Sunahara et al., 1996; Denninger and Marletta, 1999), it is reasonable to assume that one or more of the components of the AC/PKA pathway stimulate GC, establishing a cross talk with the GC/PKG pathway.
PKG Activity Is Essential for CBF Enhancement Induced by ACh
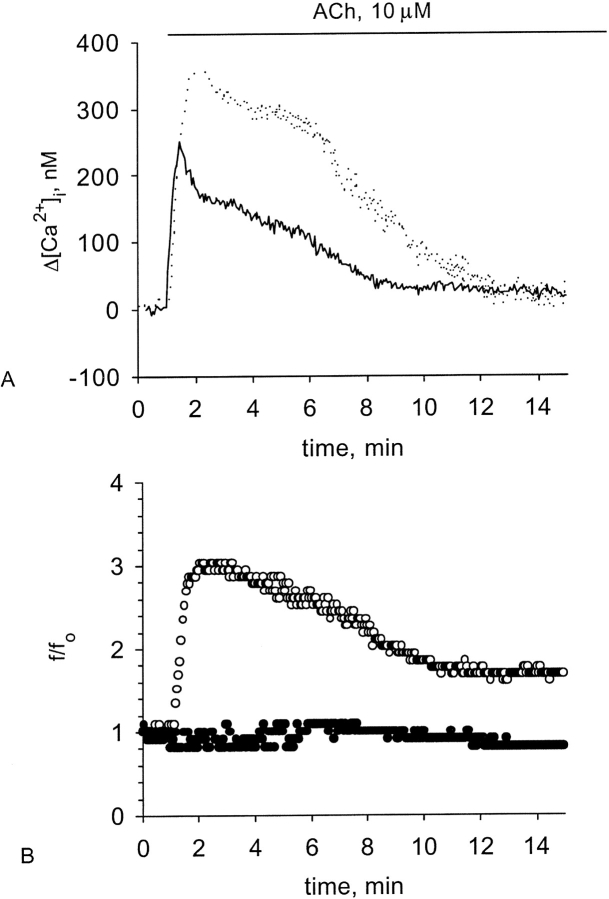
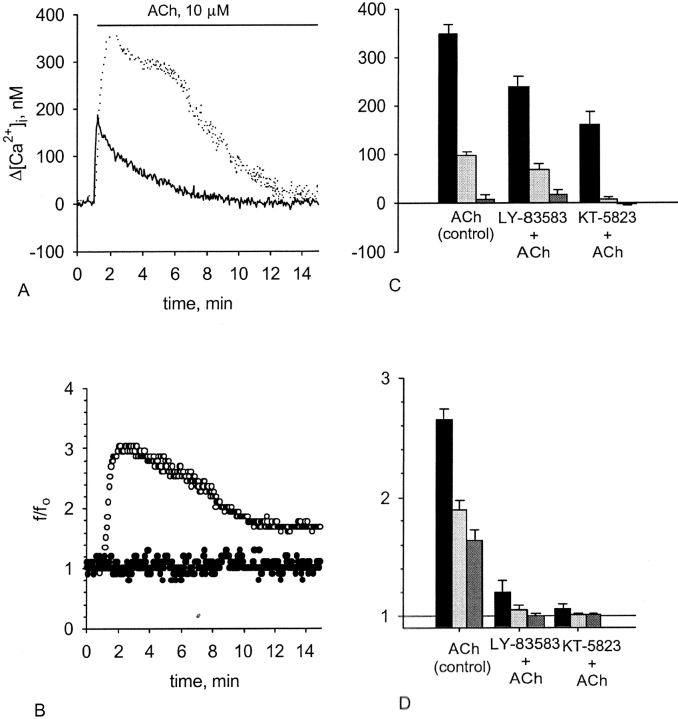
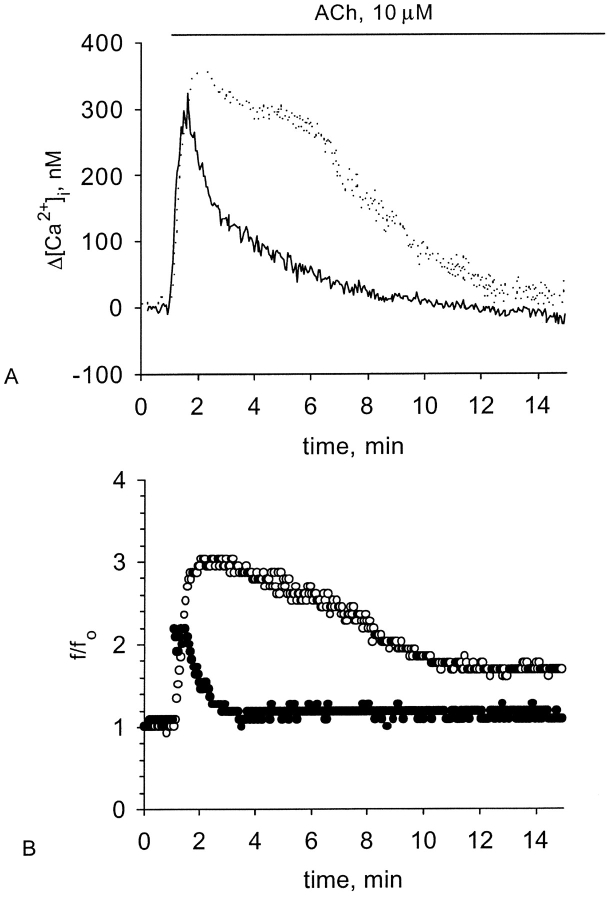
To evaluate the role of the cGMP-PKG pathway in the process of CBF enhancement induced by ACh, two inhibitors were used: a GC inhibitor LY83583 (IC50 = 2 μM; Fleisch et al., 1984) and a PKG inhibitor KT5823 (IC50 = 0.234 μM; Grider, 1993). The responses in [Ca2+]i and CBF to 10 μM ACh were monitored simultaneously from the same cell, which was either untreated, or pretreated with 50 μM LY83583, or pretreated with 0.5 μM KT5823. Addition of 10 μM ACh to tissue cultures pretreated with either the inhibitor of GC or the inhibitor of PKG resulted in a partial attenuation of the [Ca2+]i rise (by ∼25 and 50%, respectively) and in a complete inhibition of the CBF enhancement (Figs. 4 and 5). The decrease in the [Ca2+]i rise produced by the inhibitors is incomparable to their deleterious effect on the CBF enhancement. Moreover, the results shown below (see Figs. 6 and 7) and published elsewhere (Korngreen and Priel, 1996; Levin et al., 1997) indicate that a [Ca2+]i rise of a similar magnitude can evoke a strong CBF enhancement. The mechanism of the cGMP/PKG involvement in the dynamic regulation of [Ca2+]i is not yet known, and is beyond the scope of this work. Nevertheless, it is possible to conclude that PKG activity is essential for CBF enhancement induced by ACh, even in the presence of high [Ca2+]i.
Figure 4.
Effect of GC blockage on the [Ca2+]i and CBF enhancement induced by ACh. Representative experiments of responses in [Ca2+]i (A) and CBF (B) to 10 μM ACh obtained from either untreated cells (A, dotted line; B, open circles) or from the cells treated with 50 μM LY-83583 (A, solid line; B, closed circles). Inhibition of GC slightly attenuates the rise in [Ca2+]i but completely abolishes the rise in CBF normally induced by ACh.
Figure 5.
Effect of the PKG pathway blockage on the [Ca2+]i and CBF enhancement induced by ACh. Representative experiments of responses in [Ca2+]i (A) and CBF (B) to 10 μM ACh obtained from either untreated cells (A, dotted line; B, open circles) or from the cells treated with 0.5 μM KT-5823 (A, solid line; B, closed circles). C and D show [Ca2+]i elevation (C) and CBF enhancement (D) induced by 10 μM ACh in either untreated cells or in the cells pretreated with either 50 μM LY-83583 or 0.5 μM KT-5823. Each group of bars represents the maximal increase (left bar in the group) in [Ca2+]i or CBF, the increase obtained 5 min after reaching the maximum (middle bar in the group), and the increase obtained 10 min after reaching the maximum (right bar in the group). Inhibition of either GC or PKG partially attenuates the rise in [Ca2+]i but completely abolishes the rise in CBF normally induced by ACh. Each bar represents an average over 10–19 experiments with error bars representing the SEM.
Figure 6.
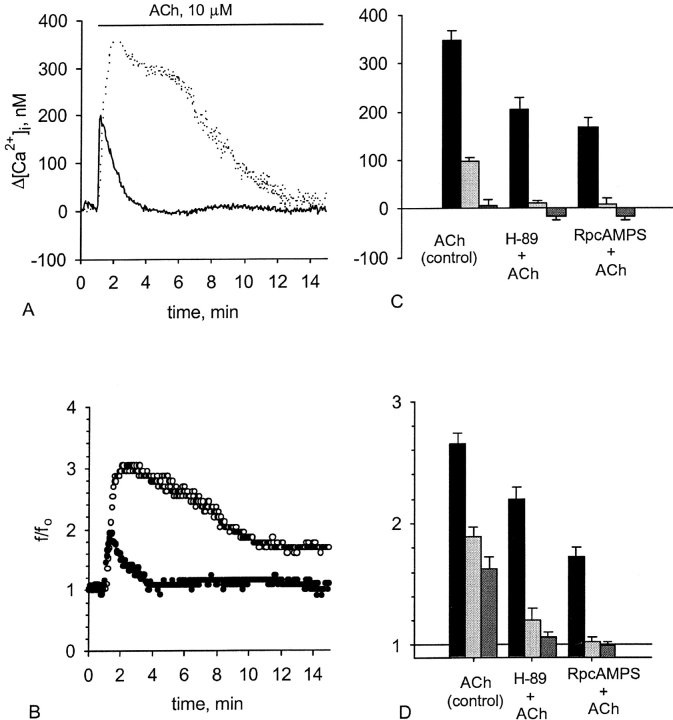
Effect of the PKA pathway blockage on the [Ca2+]i and CBF enhancement induced by ACh. Representative experiments of responses in [Ca2+]i (A) and CBF (B) to 10 μM ACh obtained from either untreated cells (A, dotted line; B, open circles) or from the cells treated with 5 μM H-89 (A, solid line; B, closed circles). Inhibition of PKA attenuates the first phase of the response and completely abolishes the second phase of the response in both [Ca2+]i and CBF normally induced by ACh.
Figure 7.
Effect of the PKA pathway blockage on the [Ca2+]i and CBF enhancement induced by ACh. Representative experiments of responses in [Ca2+]i (A) and CBF (B) to 10 μM ACh obtained from either untreated cells (A, dotted line; B, open circles) or from the cells treated with 100 μM Rp-8-Br-MB-cAMPS (A, solid line; B, closed circles). C and D show [Ca2+]i elevation (C) and CBF enhancement (D) induced by 10 μM ACh in either untreated cells or in the cells pretreated with either 5 μM H-89 or 100 μM Rp-8-Br-MB-cAMPS. Each group of bars represents the maximal increase (left bar in the group) in [Ca2+]i or CBF, the increase obtained 5 min after reaching the maximum (middle bar in the group), and the increase obtained 10 min after reaching the maximum (right bar in the group). Inhibition of PKA attenuates the first phase of the response and completely abolishes the second phase of the response in both [Ca2+]i and CBF normally induced by ACh. Each bar represents an average over 8–20 experiments with error bars representing the SEM.
PKA Sustains the Second Phase of the CBF Response to ACh
To assess the role of PKA in stimulation of CBF by ACh, we used two PKA inhibitors with two different modes of action: H89 and Rp-8-Br-MB-cAMPS. H-89 is a protein kinase inhibitor with a high specificity to PKA, which interferes with the activity of the target enzyme by binding to its catalytic domain (Chijiwa et al., 1990). Rp-8-Br-MB-cAMPS is a cell-permeable structural analogue of cAMP that competes with the endogenous cAMP for binding to the regulatory domain of PKA and, thereby, prevents activation of the enzyme. This inhibitor is highly specific for PKA and prefers PKA type I over PKA type II (Gjertsen et al., 1995).
The responses in [Ca2+]i and CBF to 10 μM ACh were monitored simultaneously from the same cell, which was either untreated, or pretreated with 5 μM H-89, or pretreated with 100 μM Rp-8-Br-MB-cAMPS. Both inhibitors produced essentially identical effects. The response to ACh of the cells pretreated with the inhibitors was attenuated by 40–50% and significantly shortened (Figs. 6 and 7). The rise in [Ca2+]i was diminished by 40–50% and followed by a relatively fast decay (within 1–3 min after reaching the maximum) to its basal level. The CBF enhancement was also attenuated, and the degree of the attenuation was similar to the degree of inhibition in the [Ca2+]i elevation. In addition, the second phase of the CBF enhancement was completely abrogated, and CBF declined to its basal level in a striking accordance with [Ca2+]i (Figs. 6 and 7).
According to the IC50 values of H-89 in mammalian tissues (0.05 μM for PKA and 0.5 μM for PKG), this blocker, used at 5 μM, is expected to inhibit the PKG activity as well. However, since the effect of H-89 (Figs. 6 and 7) was strikingly different from the effect of the PKG and GC inhibitors (Figs. 4 and 5), and, at the same time, it was virtually identical to the effect produced by the highly specific PKA inhibitor Rp-8-Br-MB-cAMPS (Fig. 7), it is safe to assume that H-89 did not inhibit PKG in our preparation. The discrepancy may be a result of the differences in the enzyme sensitivity or in the membrane permeability to H-89 between the mammalian and the frog tissue. These results suggest that PKA activity contributes to the duration and the magnitude of the first phase and is obligatory for the existence of the second phase of the response to ACh.
DISCUSSION
Interplay between Ca2+, cGMP, and cAMP in the Process of CBF Enhancement
Over the last two decades, several works were published which demonstrate that CBF can be enhanced by one of the three ubiquitous second messengers: Ca2+, cGMP, or cAMP. In most studies, the role of each pathway represented by these messengers was examined and presented separately. Such an approach created an impression that each of the second messengers represented an independent pathway for regulation of ciliary activity. In contrast to this view, this work demonstrates that these pathways are closely interconnected, and that their combined effect is required to achieve a strong and sustained CBF enhancement.
We previously have shown that CBF enhancement induced by ACh crucially relies on rise in [Ca2+]i (Zagoory et al., 2001). ACh achieves this effect by mobilization of Ca2+ from the intracellular stores. In this work, we demonstrate that ACh also elevates the cytosolic levels of cGMP and cAMP. It was shown that inhibition of calmodulin abolishes the CBF enhancement induced by ACh in the presence of high [Ca2+]i (Zagoory et al., 2001), conforming to the findings that calmodulin is essential for the CBF enhancement normally induced by ATP or by a calcium ionophore in the tissue cultures from frog esophagus and from rabbit trachea (Braiman et al., 2000b). These results indicate that calcium ions themselves cannot enhance CBF. On the other hand, it is well-known that Ca-CaM triggers a multitude of cellular events, including activation of GC and AC (Hinrichsen, 1993; Antoni, 1997; Stuehr, 1999; Chin and Means, 2000; Groves and Wang, 2000). Activated GC and AC increase the intracellular levels of the correspondent cyclic nucleotides cGMP and cAMP. Indeed, activation of muscarinic receptors by ACh induced a strong, time-dependent rise in the cytosolic levels of cGMP and cAMP (Fig. 1). Moreover, the rise in the concentrations of both nucleotides was strongly attenuated by pretreatment of the cells with a calmodulin inhibitor or by impeding the [Ca2+]i rise (Fig. 2). In addition, the time course of the cGMP elevation closely resembles the response in [Ca2+]i induced by ACh (Figs. 1 and 4–7). Taken together, these results indicate that the rise in the cGMP level is mainly mediated by Ca-CaM.
The interplay between cAMP and Ca-CaM appears to be more complex. Inhibition of CaM impedes the rise in the cAMP level (Fig. 2), suggesting that the rise in the cAMP level is also mediated by Ca-CaM. On the other hand, the time course of the cAMP rise exhibits a different behavior as compared with [Ca2+]i (Figs. 1 and 4–7). The level of cAMP reaches its maximum in 10 min after stimulation and is maintained elevated for a relatively long time after [Ca2+]i decays to its basal level. These results suggest that Ca-CaM is essential for initiation of the rise in cAMP, probably via activation of CaM-dependent AC. However, the ACh receptors utilize an additional, Ca2+-independent pathway to maintain high levels of cAMP. It is tempting to suggest that activation of the muscarinic receptors leads to inhibition of cAMP-specific phosphodiesterases, since preincubation of the tissue with the phosphodiesterase inhibitor IBMX strongly inhibited the ability of ACh to increase further the cAMP concentration (not shown).
Comparison between the time courses of the response in cytosolic Ca2+, cGMP, and cAMP levels and CBF (Figs. 1 and 4–7) demonstrates that during the initial strong CBF enhancement followed by a partial decay, the concentrations of all three second messengers are elevated. However, during the first phase, the rise in the concentrations of cytosolic Ca2+ and cGMP are more pronounced and highly correlated with the CBF enhancement. On the other hand, the second phase of the response (a sustained moderate enhancement of CBF) seems to be an outcome of the elevation in the cAMP concentration, probably via PKA activation.
The Role of PKG and PKA in the ACh-induced Ciliary Stimulation
Obviously, the rise in cGMP and cAMP concentrations leads to activation of the correspondent kinases—PKG and PKA. Indeed, inhibition of either PKG or GC abolished completely the CBF enhancement induced by ACh (Figs. 4 and 5). It is important to emphasize that inhibition of either PKG or GC also attenuated the [Ca2+]i elevation induced by ACh. Therefore, one might speculate that the abolishment of CBF enhancement resulted from the attenuation in [Ca2+] rise. However, whereas the maximal rise in [Ca2+]i induced by ACh in the cells treated with either the PKA inhibitors or the GC/PKG inhibitors were statistically indifferent, a significant enhancement in CBF was observed in the cells treated with the PKA inhibitors. Thus, the partial attenuation in [Ca2+] rise is unlikely to account for the complete abolishment of CBF enhancement obtained following GC/PKG inhibition. In addition, results published elsewhere (Korngreen and Priel, 1996; Levin et al., 1997) also indicate that the [Ca2+]i rise of a similar magnitude or less can evoke a strong CBF enhancement. Therefore, abolishment of the CBF enhancement induced by the PKG or GC inhibitors is not a result of a decrease in the [Ca2+]i response.
Similar results were obtained using extracellular ATP as an agonist in tissue cultures from frog esophagus or in tissue cultures from rabbit trachea (Uzlaner and Priel, 1999; Braiman et al., 2001), suggesting the generality of these findings. Furthermore, we previously have shown that the AC-stimulating agent forskolin activates CBF in a Ca2+-dependent and a Ca2+-independent manner (Braiman et al., 1998). Both effects are mediated through PKA. Yet, the PKG inhibitor KT5823 abolished both modes of the forskolin-induced CBF enhancement (unpublished data). These results indicate that PKG is a universal key player in the process of ciliary stimulation. The PKG activity is necessary for the CBF enhancement, whether it is mediated through Ca2+ or PKA. Elevation in the cGMP concentration, observed after application of forskolin (Fig. 3), further supports this idea.
Inhibition of PKA produced a profound change in the time course of the CBF enhancement induced by ACh (Figs. 6 and 7). The rise in CBF was transient, rapidly decaying to its basal level within 2–3 min after application of ACh. The rise in [Ca2+]i was also considerably shortened and attenuated. Similar transient response, accompanied by a high correlation between CBF and [Ca2+]i, was observed as a normal response to ACh in tissue cultures from ovine trachea (Salathe et al., 1997; Salathe and Bookman, 1999). It is tempting to suggest that such a discrepancy may be due to either an under activation of cAMP/PKA pathway in the tissue culture used by Salathe et al. (1997) or over activation of this pathway in our tissue culture.
It was shown that, in tissue cultures from frog esophagus, PKA induced a release of Ca2+ from the intracellular stores (Braiman et al., 1998), most probably by phosphorylation of the IP3 receptor (Burgess et al., 1991). Therefore, it is not surprising that inhibition of PKA shortened and attenuated the rise in [Ca2+]i induced by ACh, which consequently led to the reduction of a comparable magnitude in the CBF enhancement during the first phase of the response. Apparently, PKA facilitates Ca2+ mobilization from the intracellular stores and, thereby, prolongs and augments the first, Ca2+-dependent phase of the CBF enhancement.
We have shown that the rise in [Ca2+]i is essential for initiation, but not maintenance, of the second phase of the CBF enhancement induced by ACh (Zagoory et al., 2001). However, despite a significant initial rise in [Ca2+]i, the second phase of the response did not develop in the cells pretreated by the PKA blockers (Figs. 6 and 7). These results further support the conclusion that PKA controls the second phase of the CBF enhancement induced by ACh, namely the sustained moderately excited state of CBF. To support this idea even further, it is worth mentioning that application of forskolin to tissue cultures from frog esophagus also produces a biphasic response in CBF with a second phase being virtually identical to the one produced by ACh (Braiman et al., 1998). In addition, we have shown here that application of either ACh, or forskolin or the calcium mobilizing agent thapsigargin lead to an increase in the cGMP levels (Fig. 3). However, the increase in cGMP induced by either ACh or forskolin, which also profoundly increases the cAMP concentration, is significantly stronger than the increase in cGMP induced by the calcium elevation alone. Apparently, in addition to the ability of PKA to elevate the cGMP concentration through Ca2+ mobilization, another mode exists for the cAMP pathway to stimulate the cGMP pathway. The nature of this mode is yet to be found.
Molecular Events Induced by ACh
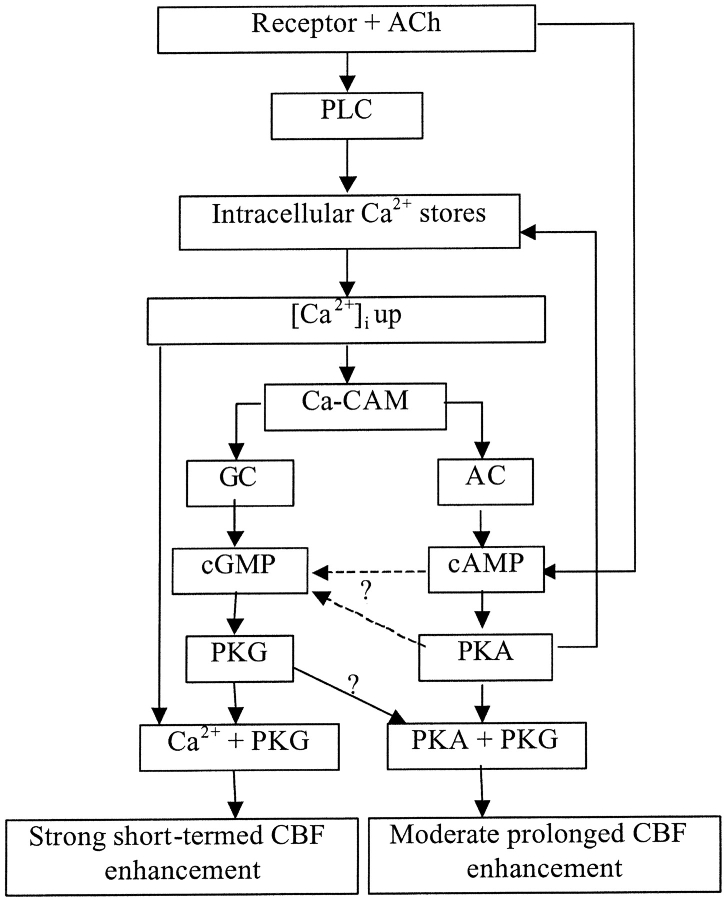
Combining the results of this work with the results published previously (Zagoory et al., 2001), we suggest the following cascade of molecular events that underlies the biphasic CBF enhancement induced by ACh (Fig. 8). Stimulation of muscarinic receptors by ACh leads to activation of phospholipase C (PLC) and mobilization of Ca2+ from the intracellular stores. Elevation in [Ca2+]i results in formation of Ca-CaM, which activates GC and AC. The increased levels of cGMP and cAMP activate the corresponding kinases, PKG and PKA. The latter augments and prolongs the response by facilitation of Ca2+ release from the intracellular stores. In addition, PKA or cAMP enhances the elevation in cGMP by an unknown mechanism. The concerted action of PKG, PKA, and elevated [Ca2+]i results in a strong CBF enhancement (the first phase). At the same time, muscarinic receptors utilize an additional pathway to maintain a high level of cAMP, possibly through inhibition of cAMP degradation. As a result, whereas the [Ca2+]i gradually decreases, the cAMP concentration and, consequently, the PKA activity remain high. The active PKA maintains a stable moderately excited state of CBF in a Ca2+-independent manner (the second phase). The unimpaired functioning of PKG is required for this step to develop.
Figure 8.
Molecular events underlying the ACh-induced ciliary stimulation.
To conclude, in this work, we show that the Ca2+, cGMP, and cAMP signaling pathways are intimately interconnected in the process of ciliary stimulation by ACh. An unimpeded PKG activity is essential for the CBF enhancement. The initial strong CBF enhancement in response to ACh is mainly governed by PKG and elevated [Ca2+]i. The second phase of CBF enhancement induced by ACh, a stable moderately elevated CBF, requires PKG activation but is mainly regulated by PKA in a Ca2+-independent manner.
Acknowledgments
A. Braiman acknowledges the fellowship support of the Kreitman Foundation. This work was partially supported by The Israeli Science Foundation founded by the Israeli Academy of Sciences and Humanities.
Footnotes
Abbreviations used in this paper: AC, adenylate cyclase; ACh, acetylcholine, Ca-CaM, calcium–calmodulin complex; CaM, calmodulin; CBF, ciliary beat frequency; GC, guanylate cyclase.
References
- Aiello, E., J. Kennedy, and C. Hernandez. 1991. Stimulation of frog ciliated cells in culture by acetylcholine and substance P. Comp. Biochem. Physiol. 99:497–506. [DOI] [PubMed] [Google Scholar]
- Antoni, F.A. 1997. Calcium regulation of adenylate cyclase. Relevance for endocrine control. Trends Endocrinol. Metab. 8:7–14. [DOI] [PubMed] [Google Scholar]
- Braiman, A., and Z. Priel. 2001. Intracellular stores maintain stable cytosolic Ca2+ gradients in epithelial cells by active Ca2+ redistribution. Cell Calcium. 30:361–371. [DOI] [PubMed] [Google Scholar]
- Braiman, A., S.D. Silberberg, and Z. Priel. 2000. a. Purinergic stimulation of ciliary activity. Drug Dev. Res. 50:550–554. [Google Scholar]
- Braiman, A., N. Uzlaner, and Z. Priel. 2000b. The role of cyclic nucleotide pathways and calmodulin in ciliary stimulation. IMA Volume on Computational Modeling in Biological Fluid Dynamics. Vol. 124. L.J. Fauci and S. Gueron, editors. Springer-Verlag, New York. 53–64.
- Braiman, A., N. Uzlaner, and Z. Priel. 2001. Enhancement of CBF is dominantly controlled by PKG and/or PKA. Cilia and Mucus, from Development to Respiratory Defense. M. Salathe, editor. Marcel Dekker, New York. 67–79.
- Braiman, A., O. Zagoory, and Z. Priel. 1998. PKA induces Ca2+ release and enhances ciliary beat frequency in a Ca2+-dependent and -independent manner. Am. J. Physiol. 275:C790–C797. [DOI] [PubMed] [Google Scholar]
- Burgess, G.M., G.S. Bird, J.F. Obie, and J.W. Putney. 1991. The mechanism for synergism between phospholipase C- and adenylylcyclase-linked hormones in liver. Cyclic AMP-dependent kinase augments inositol triphosphate-mediated Ca2+ mobilization without increasing the cellular level of inositol phosphates. J. Biol. Chem. 266:4772–4781. [PubMed] [Google Scholar]
- Chijiwa, T., A. Mishima, M. Hagiwara, M. Sano, K. Hayashi, T. Inoue, K. Naito, T. Toshioka, and H. Hidaka. 1990. Inhibition of forskolin-induced neurite outgrowth and protein phosphorylation by a newly synthesized selective inhibitor of cyclic AMP-dependent protein kinase, N-[2-(p-bromocinnamylamino)ethyl]-5-isoquinolinesulfonamide (H-89), of PC12D pheochromocytoma cells. J. Biol. Chem. 265:5267–5272. [PubMed] [Google Scholar]
- Chin, D., and A.R. Means. 2000. Calmodulin: a prototypical calcium sensor. Trends Cell Biol. 10:322–328. [DOI] [PubMed] [Google Scholar]
- Chu, S., and J.R. Kennedy. 1994. Intra-epithelial palatine nerve endings and their regulation of ciliary activity of frog palate epithelium. J. Comp. Physiol. 175:505–518. [DOI] [PubMed] [Google Scholar]
- Denninger, J.W., and M.A. Marletta. 1999. Guanylate cyclase and the NO/cGMP signaling pathway. Biochim. Biophys. Acta. 1411:334–350. [DOI] [PubMed] [Google Scholar]
- Di Benedetto, G., C.J. Magnus, P.T.A. Gray, and A. Mehta. 1991. a. Calcium regulation of ciliary beat frequency in human respiratory epithelium in vitro. J. Physiol. 439:103–113. [DOI] [PMC free article] [PubMed] [Google Scholar]
- Di Benedetto, G., F.S. Manara-Shediac, and A. Mehta. 1991. b. Effect of cyclic AMP on ciliary activity of human respiratory epithelium. Eur. Respir. J. 4:789–795. [PubMed] [Google Scholar]
- Eshel, D., Y. Grossman, and Z. Priel. 1985. Spectral characterization of ciliary beating: variations of frequency with time. Am. J. Physiol. 249:C160–C165. [DOI] [PubMed] [Google Scholar]
- Fleisch, J.H., K.D. Haisch, S.M. Spaethe, L.E. Rinkema, G.J. Cullinan, M.J. Schmidt, and W.S. Marshall. 1984. Pharmacologic analysis of two novel inhibitors of leukotriene (slow reacting substance) release. J. Pharmacol. Exp. Ther. 229:681–689. [PubMed] [Google Scholar]
- Geary, C.A., C.W. Davis, A.M. Paradiso, and R.C. Boucher. 1995. Role of CNP in human airways: cGMP-mediated stimulation of ciliary beat frequency. Am. J. Physiol. 268:L1021–L1028. [DOI] [PubMed] [Google Scholar]
- Gheber, L., and Z. Priel. 1989. Synchronization between beating cilia. Biophys. J. 55:183–191. [DOI] [PMC free article] [PubMed] [Google Scholar]
- Gheber, L., and Z. Priel. 1994. Metachronal activity of cultured mucociliary epithelium under normal and stimulated conditions. Cell Motil. Cytoskelet. 28:333–345. [DOI] [PubMed] [Google Scholar]
- Gheber, L., Z. Priel, C. Aflalo, and V. Shohsan-Barmatz. 1995. Extracellular ATP binding proteins as potential receptors in mucociliary epithelium: characterization using [32P]3′-O-(4-benzoyl)benzoyl ATP, a photoaffinity label. J. Membr. Biol. 147:83–93. [DOI] [PubMed] [Google Scholar]
- Gjertsen, B.T., G. Mellgren, A. Otten, E. Maronde, H.G. Genieser, B. Jastorff, O.K. Vintermyr, G.S. McKnight, and S.O. Doskeland. 1995. Novel (Rp)-cAMPS analogs as tools for inhibition of cAMP-kinase in cell culture. Basal cAMP-kinase activity modulates interleukin-1 beta action. J. Biol. Chem. 270:20599–20607. [DOI] [PubMed] [Google Scholar]
- Grider, J.R. 1993. Interplay of VIP and nitric oxide in regulation of the descending relaxation phase of peristalsis. Am. J. Physiol. 264:G334–G340. [DOI] [PubMed] [Google Scholar]
- Groves, J.T., and C.C.Y. Wang. 2000. Nitric oxide synthase: models and mechanisms. Curr. Opin. Chem. Biol. 4:687–695. [DOI] [PubMed] [Google Scholar]
- Grynkiewicz, G., M. Poenie, and R.Y. Tsien. 1985. A new generation of Ca2+ indicators with improved fluorescence properties. J. Biol. Chem. 260:3440–3450. [PubMed] [Google Scholar]
- Hidaka, H., Y. Sasaki, T. Tanaka, T. Endo, S. Ohno, Y. Fujii, and T. Nagata. 1981. N-(6-aminohexyl)-5-chloro-1-naphthalenesulfonamide, a calmodulin antagonist, inhibits cell proliferation. Proc. Natl. Acad. Sci. USA. 78:4354–4357. [DOI] [PMC free article] [PubMed] [Google Scholar]
- Hinrichsen, R.D. 1993. Calcium and calmodulin in the control of cellular behavior and motility. Biochim. Biophys. Acta. 1155:277–293. [DOI] [PubMed] [Google Scholar]
- Kao, J.P.Y. 1994. Practical aspects of measuring [Ca2+]i with fluorescent indicators. Methods Cell Biol. 40:155–181. [DOI] [PubMed] [Google Scholar]
- Korngreen, A., and Z. Priel. 1994. Simultaneous measurement of ciliary beating and intracellular calcium. Biophys. J. 67:1–4. [DOI] [PMC free article] [PubMed] [Google Scholar]
- Korngreen, A., and Z. Priel. 1996. Purinergic stimulation of rabbit ciliated airway epithelia: control by multiple calcium sources. J. Physiol. 497:53–66. [DOI] [PMC free article] [PubMed] [Google Scholar]
- Korngreen, A., W. Ma, Z. Priel, and S.D. Silberberg. 1998. Extracellular ATP directly gates a cation-selective channel in rabbit airway ciliated epithelial cells. J. Physiol. 508:703–720. [DOI] [PMC free article] [PubMed] [Google Scholar]
- Lansley, A.B., M.J. Sanderson, and E.R. Dirksen. 1992. Control of the beat cycle of respiratory tract cilia by Ca2+ and cAMP. Am. J. Physiol. 263:L232–L242. [DOI] [PubMed] [Google Scholar]
- Levin, R., A. Braiman, and Z. Priel. 1997. Protein kinase C induced calcium influx and sustained enhancement of ciliary beating by extracellular ATP. Cell Calcium. 21:103–113. [DOI] [PubMed] [Google Scholar]
- Mason, S.J., A.M. Paradiso, and R.C. Boucher. 1991. Regulation of transepithelial ion transport and intracellular calcium by extracellular ATP in human normal and cystic fibrosis airway epithelium. Br. J. Pharmacol. 103:1649–1656. [DOI] [PMC free article] [PubMed] [Google Scholar]
- Ovadyahu, D., D. Eshel, and Z. Priel. 1988. Intensification of ciliary motility by extracellular ATP. Biorheology. 25:489–501. [DOI] [PubMed] [Google Scholar]
- Runer, T., A. Cervin, S. Lindberg, and R. Uddman. 1998. Nitric oxide is a regulator of mucociliary activity in the upper respiratory tract. Otolaryngol. Head Neck Surg. 119:278–287. [DOI] [PubMed] [Google Scholar]
- Sade, J., N. Eliezer, A. Silberberg, and A.C. Nevo. 1970. The role of mucus in transport by cilia. Am. Rev. Respir. Dis. 102:48–52. [DOI] [PubMed] [Google Scholar]
- Salathe, M., and R.J. Bookman. 1995. Coupling of [Ca2+]i and ciliary beating in cultured tracheal epithelial cells. J. Cell Sci. 108:431–440. [DOI] [PubMed] [Google Scholar]
- Salathe, M., and R.J. Bookman. 1999. Mode of Ca2+ action on ciliary beat frequency in single ovine airway epithelial cells. J. Physiol. 520:851–865. [DOI] [PMC free article] [PubMed] [Google Scholar]
- Salathe, M., E.J. Lipson, P.I. Ivonnet, and R.J. Bookman. 1997. Muscarinic signaling in ciliated tracheal epithelial cells: dual effects on Ca2+ and ciliary beating. Am. J. Physiol. 272:L301–L310. [DOI] [PubMed] [Google Scholar]
- Sleigh, M.A. 1982. Movement and coordination of tracheal cilia and the relation of these to mucus transport. Prog Clin. Biol. Res. 80:19–24. [DOI] [PubMed] [Google Scholar]
- Sleigh, M.A., J.R. Blake, and N. Liron. 1988. The propulsion of mucus by cilia. Am. Rev. Respir. Dis. 137:726–741. [DOI] [PubMed] [Google Scholar]
- Stuehr, D.J. 1999. Mammalian nitric oxide synthases. Biochim. Biophys. Acta. 1411:217–230. [DOI] [PubMed] [Google Scholar]
- Sunahara, R.K., C.W. Dessauer, and A.G. Gilman. 1996. Complexity and diversity of mammalian adenylyl cyclases. Annu. Rev. Pharmacol. Toxicol. 36:461–480. [DOI] [PubMed] [Google Scholar]
- Takahashi, A., P. Camacho, J.D. Lechleiter, and B. Herman. 1999. Measurement of intracellular calcium. Physiol. Rev. 79:1089–1125. [DOI] [PubMed] [Google Scholar]
- Tamaoki, J., M. Kondo, and T. Takizawa. 1989. Effect of cAMP on ciliary function in rabbit tracheal epithelial cells. J. Appl. Physiol. 66:1035–1039. [DOI] [PubMed] [Google Scholar]
- Uzlaner, N., and Z. Priel. 1999. Interplay between the NO pathway and elevated [Ca2+]i enhances ciliary activity in rabbit trachea. J. Physiol. 516:179–190. [DOI] [PMC free article] [PubMed] [Google Scholar]
- Varhaus, E.F., and I.J. Deyrup. 1953. The effect of ATP on the cilia of the pharyngeal mucus of the frog. Science. 118:553–554. [DOI] [PubMed] [Google Scholar]
- Verdugo, P. 1980. Ca2+-dependent hormonal stimulation of ciliary activity. Nature. 283:764–765. [DOI] [PubMed] [Google Scholar]
- Villalon, M., T.R. Hinds, and P. Verdugo. 1989. Stimulus-response coupling in mammalian ciliated cells, Demonstration of two mechanisms of control for cytosolic [Ca2+]. Biophys. J. 56:1255–1258. [DOI] [PMC free article] [PubMed] [Google Scholar]
- Wong, L.B., and D.B. Yeates. 1992. Luminal purinergic regulatory mechanism of tracheal ciliary beat frequency. Am J. Respir. Cell Mol. Biol. 7:447–454. [DOI] [PubMed] [Google Scholar]
- Yang, B., R.J. Schlosser, and T.V. McCaffry. 1996. Dual signal transduction mechanisms modulate ciliary beat frequency in upper airway epithelium. Am. J. Physiol. 270:L745–L751. [DOI] [PubMed] [Google Scholar]
- Zagoory, O., A. Braiman, L. Gheber, and Z. Priel. 2001. The role of calcium and calmodulin in ciliary stimulation induced by acetylcholine. Am. J. Physiol. 280:C100–C109. [DOI] [PubMed] [Google Scholar]


