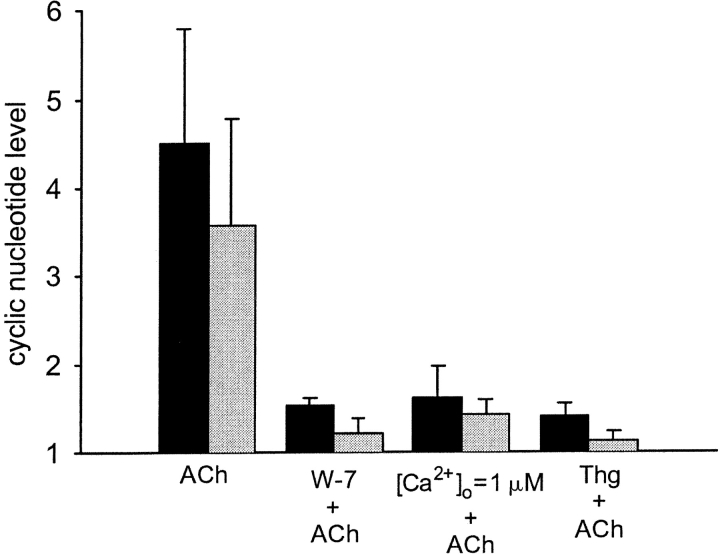
Figure 2.
Effect of Ca2+ pathway blockage on the cGMP and cAMP levels induced by ACh. Each group of bars represents the maximal elevation in the intracellular level of cGMP (dark bars) and cAMP (light bars) after stimulation with 10 μM ACh in either untreated cells (control) or in the cells treated with 150 μM W-7, low extracellular calcium concentration or 1 μM thapsigargin. Depletion of intracellular calcium stores or inhibition of CaM impedes the elevation in the cGMP and cAMP levels normally induced by ACh. The changes in the levels of each nucleotide are shown as a normalized increase relative to the levels of the same nucleotide obtained in the presence of the blocker, before application of ACh. Each bar represents an average over three to five experiments with error bars representing the SEM.

