Figure 5.
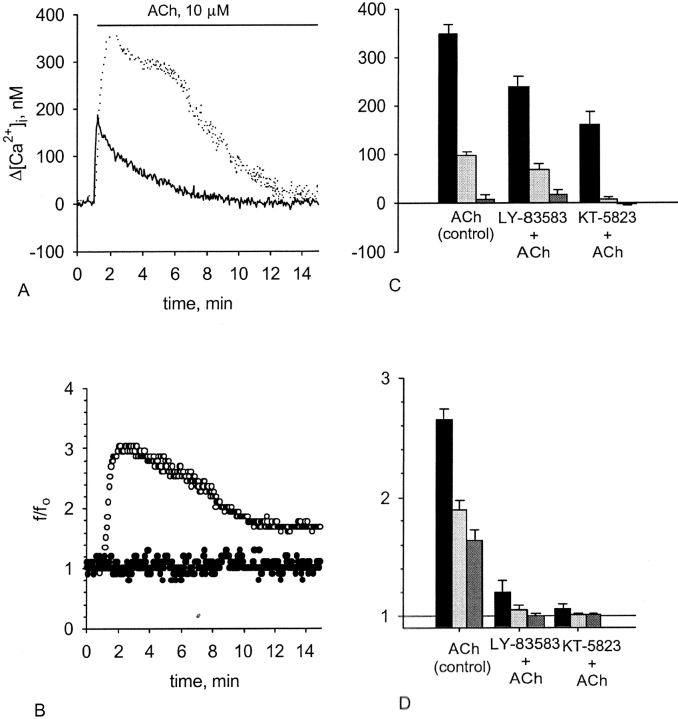
Effect of the PKG pathway blockage on the [Ca2+]i and CBF enhancement induced by ACh. Representative experiments of responses in [Ca2+]i (A) and CBF (B) to 10 μM ACh obtained from either untreated cells (A, dotted line; B, open circles) or from the cells treated with 0.5 μM KT-5823 (A, solid line; B, closed circles). C and D show [Ca2+]i elevation (C) and CBF enhancement (D) induced by 10 μM ACh in either untreated cells or in the cells pretreated with either 50 μM LY-83583 or 0.5 μM KT-5823. Each group of bars represents the maximal increase (left bar in the group) in [Ca2+]i or CBF, the increase obtained 5 min after reaching the maximum (middle bar in the group), and the increase obtained 10 min after reaching the maximum (right bar in the group). Inhibition of either GC or PKG partially attenuates the rise in [Ca2+]i but completely abolishes the rise in CBF normally induced by ACh. Each bar represents an average over 10–19 experiments with error bars representing the SEM.

