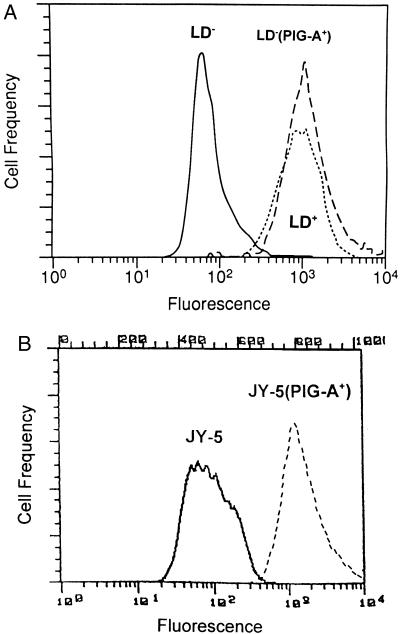
Figure 3.
Flow cytometric analysis for CD59 expression. (A) The GPI anchor-deficient, LD− (solid line), and the GPI anchor-replete, LD+ (dotted line), Epstein–Barr virus-transformed B lymphoblastoid cell lines were derived from a patient with PNH. LD− (PIG-A+) (dashed line) was established after stable transfection of the PIG-A cDNA into the LD− cell line. (B) The GPI anchor-deficient JY-5 cells (solid line) and JY-5 (PIG-A+) cells (dashed line).

