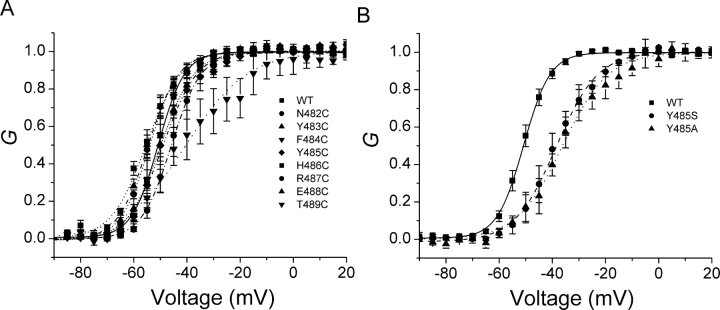
Figure 2.
Normalized G-V curves. The G values were obtained from the tail currents at −60 mV. The smooth lines are fits to a Boltzmann function, with fitting parameters summarized in Table I. A shows all cysteine mutants, and B shows two other mutants of residue Y485.

