
Figure 5.
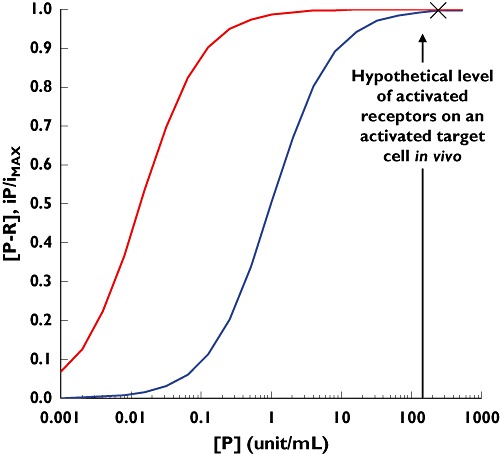
Simulation of a hypothetical operational model of agonism describing the relationship between the receptor activation on a target cell (blue curve) and the resulting infection rate of the target cell (red curve). The simulation is based on Equations 13 and 14 with parameters [RT] = 1; KP = 1; KE = 0.012