
Figure 6.
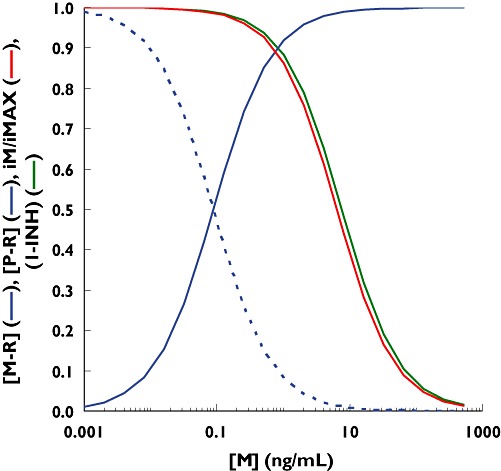
Simulation of the fraction of activated CCR5 receptors occupied by maraviroc. [Blue curve: (M-R) based on (6)], remaining free activated CCR5 receptors on a target cell [blue dash curve: (P-R) = 1 − (M-R)], in vivo estimated inhibition of the infection rate [green curve: 1-INH of Equations 1–4 based on (5)] and operational inhibition of the infection rate based on Equation 17 and a KE value of 0.012 [P-R]/cell (red curve)]. M = maraviroc