
Figure 8.
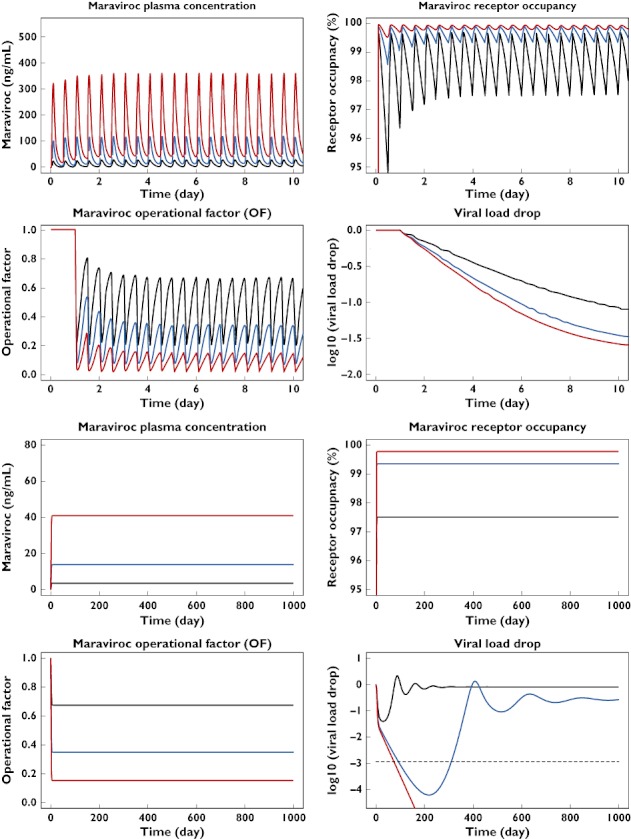
Simultaneous simulation of maraviroc plasma concentration, CCR5 receptor occupancy, operational factor and viral load–time profiles after short (four top graphs, full profiles) or long (four bottom graphs, trough values) term oral administration of maraviroc in a typical HIV-positive patient. LOQ indicates the limit of quantification of RNA copies. 25 mg bid (—); 100 mg bid ( ); 300 mg bid (
 );
);