Figure 2.

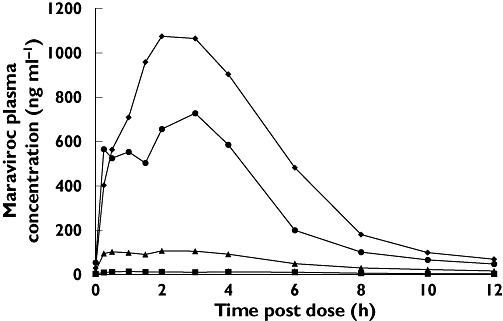
Linear plot of mean plasma maraviroc concentrations measured at steady state on day 12 (study 2, cohorts 1, 2, 4 and 5). 25 mg b.i.d. (▪); 100 mg b.i.d. (▴); 300 mg b.i.d. ( ); 600 mg q.d. (♦)

Linear plot of mean plasma maraviroc concentrations measured at steady state on day 12 (study 2, cohorts 1, 2, 4 and 5). 25 mg b.i.d. (▪); 100 mg b.i.d. (▴); 300 mg b.i.d. ( ); 600 mg q.d. (♦)